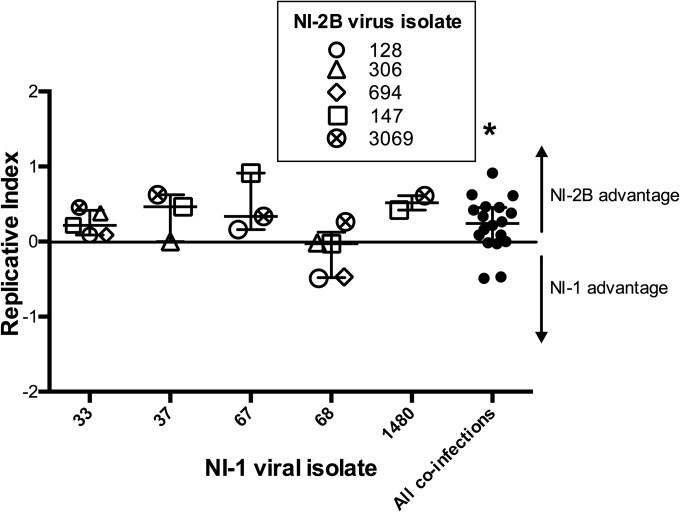
FIG 3.
Coinfection of NI-1 and NI-2B DENV-2 isolates in Aag2 mosquito cells. Aag-2 cells were infected at an MOI of 0.01 PFU/cell. The cells were infected with comparable numbers of GE of clinical isolates of NI-1 and NI-2B viruses mixed as indicated. Each NI-1 strain (indicated by the numbers on the x axis) was mixed with one of up to five different NI-2B viruses (denoted by the key) in three separate experiments. Cell supernatants were collected at 4 dpi. The ratio of the viral inoculum and viral growth on a given day in all coinfections was determined by sequencing. The data were analyzed using the replicative index, which was derived according to the formula ln[(NI-2B/NI-1 ratio on day x)/(NI-2B/NI-1 ratio on day 0)]. This parameter measures the relative log change of each clade on a given day from its input value. The neutral expectation, 0, shows no change in relative proportion from the input and is indicated by the horizontal line. The Wilcoxon signed rank test comparing the experimental results to the baseline value of 0 was used to determine significance. Error bars show the 25th and 75th percentiles. The line in the middle indicates the median. *, P= 0.027.

