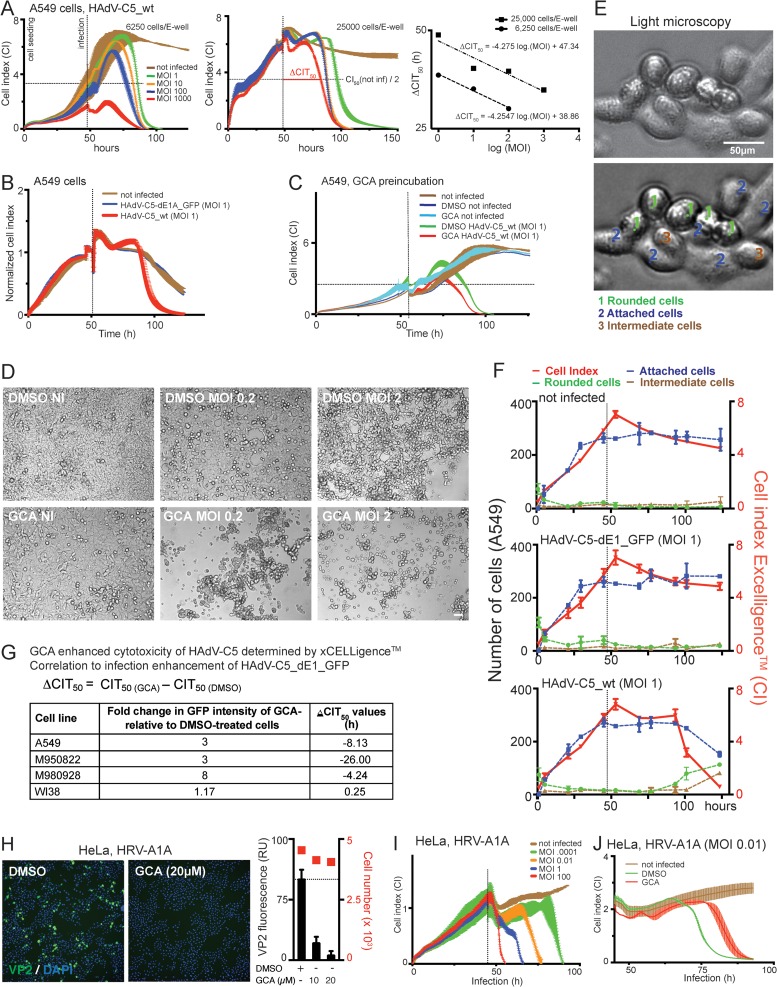
FIG 5.
Inhibition of GBF-1 enhances HAdV-induced cytopathic effects but blocks rhinovirus infection. (A) CI profiles from impedance measurements of A549 cells infected with HAdV-C5_wt indicate cytopathic effects. Impedance was recorded every 15 min using an xCELLigence system. Each point represents the average value from two replicates with SDs. The times on the x axis indicate the times after cell seeding. Vertical lines show the time of infection, and horizontal lines refer to 50% of the maximum CI of noninfected cells. (Right) Regression fit of ΔCIT50 values, where each point represents a single ΔCIT50 value. Note that the CI profile of HAdV-C5_wt infection is MOI dependent but not cell density dependent. (B) A549 cells infected with HAdV-C5_wt (red) or replication-deficient HAdV-C5-dE1_GFP (blue) yield significantly different CI profiles. The profile of HAdV-C5-dE1_GFP-infected cells is similar to that of noninfected control cells (brown). (C) A 5-h preincubation with GCA enhanced HAdV-C5_wt-induced cytotoxicity in A549 cells. Data points represent the means from two samples per condition ± SDs. (D) DIC images of control and GCA-treated (5 h preincubation) uninfected and HAdV-C5_wt-infected A549 cells at 72 h p.i. Bar, 50 μm. (E, F) Comparison of CI values with cell appearance in DIC images. (E) Representative DIC images of A549 cells classified as rounded (1, green), attached (2, blue), or in an intermediate state (3, brown). The upper image is unprocessed, whereas the lower image shows an example of images that were filtered through a band-pass filter and contrast enhanced using ImageJ software. The latter images were used for cell classification. (F) Comparison of the CI profiles of uninfected, HAdV-C5-dE1_GFP-infected (MOI, 1), and HAdV-C5_wt-infected (MOI, 1) A549 cells with the number of rounded, attached, and intermediate cells in DIC images of corresponding parallel samples. (G) Summary of GCA-mediated infection enhancement for HAdV-C5-dE1_GFP and ΔCIT50 values (h) for HAdV-C5_wt. Negative values in the ΔCIT50 column indicate that the CI of GCA-treated cells reached 50% of the maximum CI of noninfected cells earlier than control DMSO-treated cells. (H) GCA inhibits HRV-A1A infection of HeLa-Ohio cells, as indicated by anti-VP2 immunostaining. Cells were infected with HRV-A1A (MOI, 0.01) in the presence of 20 μM GCA and analyzed for VP2 expression at 7 h p.i. (Left) Representative images (green, VP2; blue, DAPI); (right) quantification of the cytoplasmic VP2 signal. (I) CI profile of HeLa-Ohio cells infected with HRV-A1A at different MOIs. Values are the averages, including SDs, from two replicates. (J) The GBF-1 inhibitor GCA reduced the HRV-A1A-induced cytopathic effect in HeLa-Ohio cells. Cells were infected with HRV-A1A (MOI, 0.01) in the presence of 20 μM GCA. Data represent the means ± SDs for 2 samples per condition.

