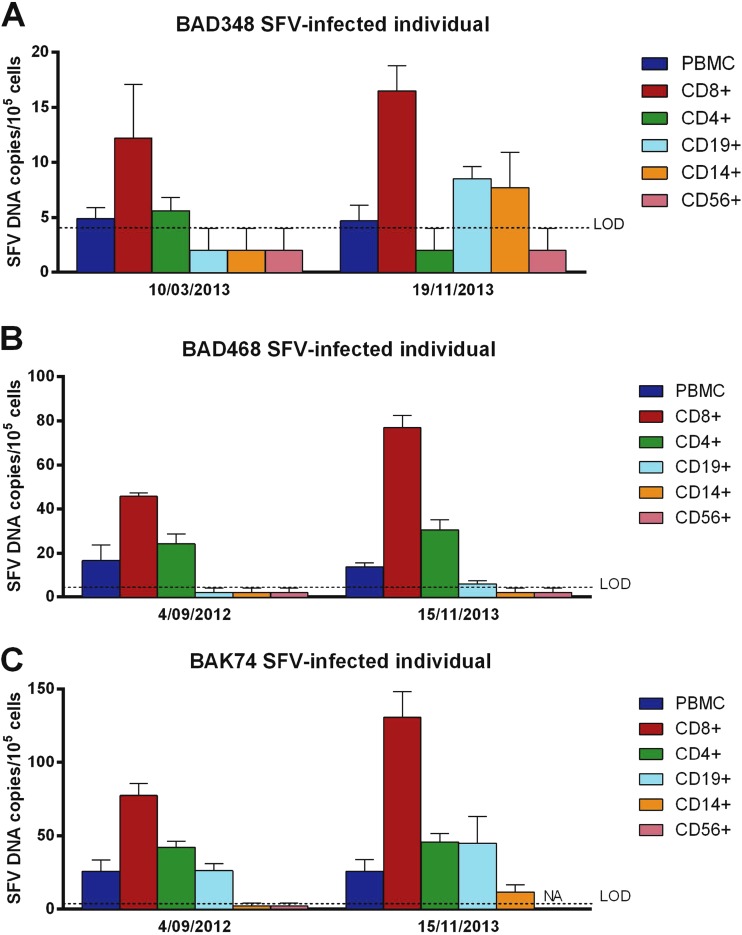
FIG 2.
SFV DNA loads in PBMC populations of 3 hunters infected with a Gorilla gorilla SFV strain at two time points. PBMC populations from 3 SFV-infected individuals were isolated, and the SFV DNA load was quantified in each PBMC population at two different time points. Each quantification was performed twice in triplicate (e.g., n = 6). Means ± standard deviations are shown. NA, not available. Values below the limit of detection (LOD) were arbitrarily set as half the LOD, 2 SFV DNA copies/105 cells.

