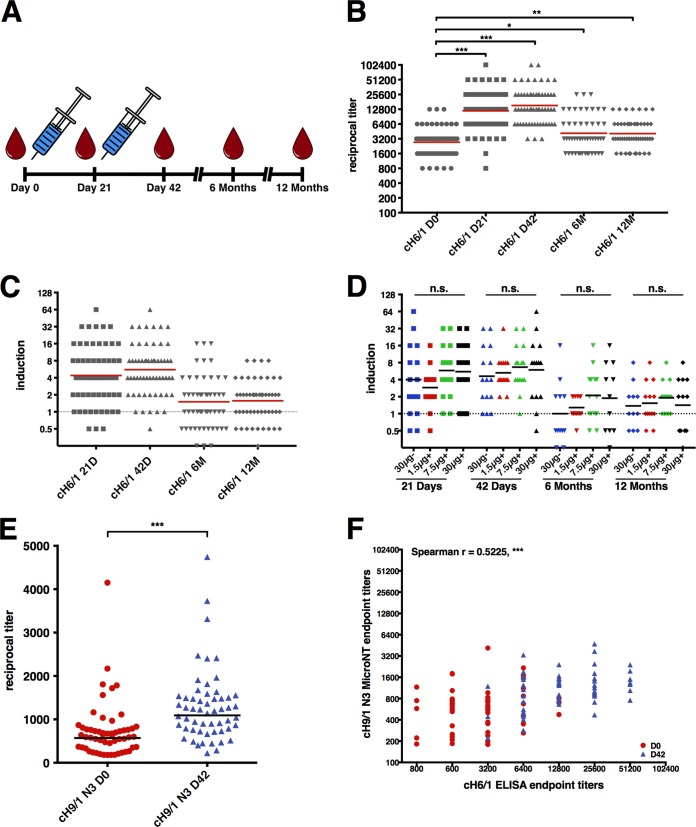
FIG 1.
H5N1 vaccination induces stalk-reactive antibodies in humans. (A) Study design. Participants received the H5N1 vaccine intramuscularly on day 0 and day 21. Blood was drawn on days 0, 21, and 42 postpriming, as well as after 6 and 12 months. (B) Stalk-reactive antibodies were measured in a cH6/1 ELISA. Reciprocal geometric mean titers on day 0 were detected at 1:2,722 and showed a high, significant increase for day 21 (1:1,1943; P < 0.0001) and day 42 (1:15,267; P < 0.0001). The levels of stalk-reactive antibodies declined after 6 months (1:4,143; P = 0.032) and remained at a similar level up to 12 months postvaccination (1:4,087; P = 0.0051), still significantly higher than baseline titers. (C) Induction of stalk-reactive antibodies over baseline. Stalk-reactive antibody titers showed a 4.4-fold induction over baseline after the first round of vaccination, with a further boost to 5.6-fold after the second round. After 6 months, the stalk-reactive antibodies declined to a level of 1.5-fold over baseline and were retained at that level for up to 12 months (1.6-fold). (D) Induction of stalk-reactive antibodies for individual vaccine groups. There was no statistical significant difference in induction of stalk-reactive antibodies for the various HA contents of the vaccines, as well as adjuvant, for any time point (21 days, P = 0.3391; 42 days, P = 0.6267; 6 months, P = 0.3068; 12 months, P = 0.9807). (E) Biological activity of stalk-reactive antibodies was measured in a microneutralization assay with a cH9/1 N3 virus. Using an HA head domain and neuraminidase to which humans are naive ensured measurement of stalk-reactive antibodies only. Baseline titers were relatively high, at 1:569, but showed a significant increase 42 days postpriming, to 1:1,092 (P < 0.0001). (F) Correlation of stalk-reactive antibodies measured by ELISA and microneutralization assay. The levels of stalk-reactive antibodies measured by ELISA significantly correlated with their measured neutralizing ability in vitro (Spearman r = 0.5225; P < 0.0001). n.s., not significant. In Fig. 1 to 4, * indicates a P value of ≤0.05, ** indicates a P value of ≤0.01, and *** indicates a P value of ≤0.001.

