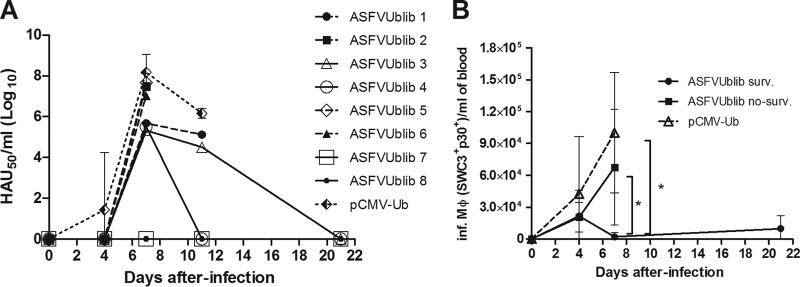
FIG 3.

(A) Evolution of virus titers in the blood of individual ASFVUblib-immunized animals and the average and standard deviations for the infected control group animals, measured by hemadsorption assay. Results shown are from experiment 3. (B) Kinetics of the detection of ASFV-infected monocytes/macrophages (Inf. Mϕ) (SWC3+ p30+) per milliliter of total blood detected by flow cytometry of infected SPF animals throughout their infection with E75CV1. Graphs show average values and standard deviations per group (*, P < 0.05).
