FIG 4.

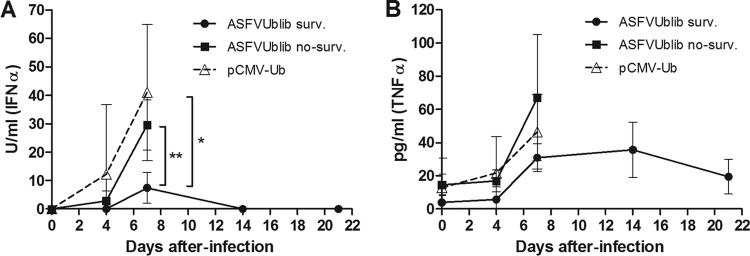
Kinetics of the detection of IFN-α (A) and TNF-α (B) in sera of infected SPF animals throughout their infection with E75CV1 (experiment 3). Graphs show average values and standard deviations per group (*, P < 0.05; **, P < 0.01).

Kinetics of the detection of IFN-α (A) and TNF-α (B) in sera of infected SPF animals throughout their infection with E75CV1 (experiment 3). Graphs show average values and standard deviations per group (*, P < 0.05; **, P < 0.01).