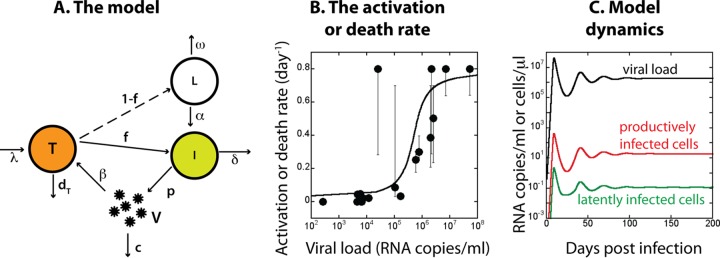
FIG 1.

Model of the dynamics of the latent reservoir in HIV infection. (A) Simple model of infection. Uninfected CD4+ T cells (T) are replaced at the rate λ and die at the rate dT. They have susceptibility β to infection by virus (V). A large fraction f is productively infected (I); they produce virus at the rate p and die at the rate δ. The remaining small fraction 1 − f is latently infected (L). They do not produce virus but are activated by virus at the rate α and die at the rate ω. (B) Dependence of activation or death rate on viral load. Full circles indicate results from reference 16; the full line shows the fit to experimental results used in modeling. (C) Dynamics of viral load (black line), productively infected cells (red line), and latently infected cells (green line) obtained from the model.
