
FIG 6.
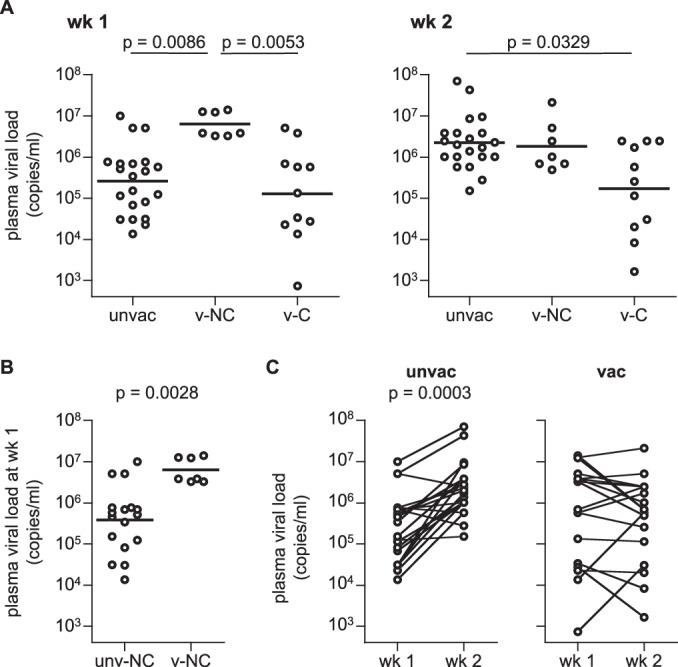
Plasma viral loads at weeks 1 and 2 after SIVmac239 challenge. (A) Comparison of viral loads in unvaccinated animals (unvac), vaccinated noncontrollers (v-NC), and vaccinated controllers (v-C) at weeks 1 (left panel) and 2 (right panel). Multiple comparisons (Kruskal-Wallis test and Mann-Whitney U test) indicated significantly higher viral loads at week 1 in v-NC than unvac and v-C (P = 0.0086 and P = 0.0053, respectively) and significantly lower viral loads at week 2 in v-C than unvac (P = 0.0329). (B) Comparison of viral loads at week 1 between unvaccinated noncontrollers (unv-NC; n = 17) and vaccinated noncontrollers (v-NC; n = 7). The load for the latter set was significantly higher than for the former (P = 0.0028 by Mann-Whitney U test). (C) Comparison of viral loads between weeks 1 and 2 in unvaccinated (left panel) and vaccinated (right panel) animals. Unvaccinated animals showed significantly higher viral loads at week 2 than week 1 (P = 0.0003 by Wilcoxon signed-rank test).