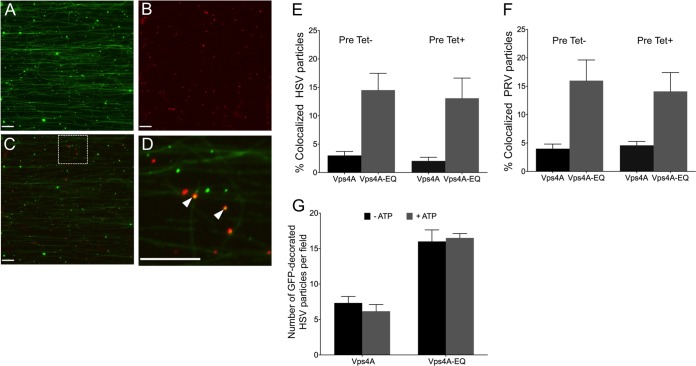
FIG 4.
Cytoplasmic viral particles bound by GFP-tagged Vps4A and Vps4A-EQ. PNS samples prepared from HSV- or PRV-infected Vps4A- or Vps4A-EQ-expressing cells were flowed into an imaging chamber precoated with green fluorescent microtubules. (A to D) Representative field of mRFP1-PRV particles prepared from Vps4A-EQ-expressing cells and viewed in the green (A) or red (B) channels or merged (C) and a ×4.5 magnification of the region boxed in panel C (D). White arrowheads indicate two PRV capsid-associated particles decorated by Vps4A-EQ. Scale bars in all panels represent 10 μm. (E, F) Quantitation of colocalization of mRFP1-tagged HSV and PRV capsids, respectively, with GFP-tagged Vps4A or Vps4A-EQ. Vps4A or Vps4A-EQ expression was induced at the time of infection (Pre Tet-) or from 16 h prior to infection (Pre Tet+) as indicated. Plotted values show the means and standard deviations. The fields counted and numbers of particles counted in each case were as described in the legend to Fig. 3I and J. (G) The addition of ATP did not change the numbers of Vps4A- and Vps4A-EQ-labeled HSV particles in vitro. PNS samples were prepared from HSV-infected Vps4A- and Vps4A-EQ-expressing cells and then flowed into an imaging chamber precoated with microtubules, The chambers were incubated in the absence or presence of ATP, and images of microscopic fields were recorded in the red (capsid) and green (Vps4A/Vps4A-EQ) channels. Plotted values represent means and standard deviations. The total numbers of particles examined in the absence and presence of ATP, respectively, were as follows: 344 and 255 (Vps4A cells), 151 and 173 (Vps4A-EQ cells).

