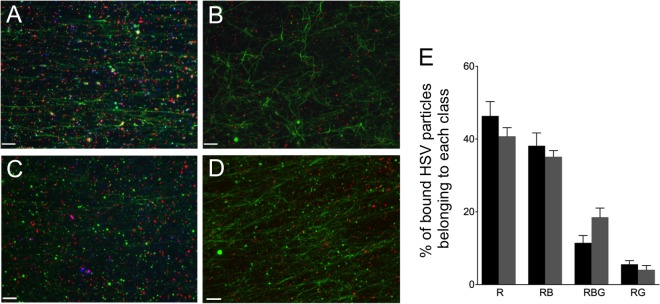
FIG 8.

PNS was prepared from HSV-infected cells and flowed into a microchamber precoated with green fluorescent microtubules, fixed, and probed first with either an anti-gD mouse monoclonal antibody (A and C) or control lacking primary antibody (B and D) and then with an Alexa Fluor 350-labeled secondary antibody. Images were collected in the red (mRFP1-VP26 capsids), green (Vps4A-GFP/Vps4A-EQ-GFP and microtubules), and blue (anti-gD) channels and then merged. (A, B) PNS from Vps4A-expressing cells. (C, D) PNS from Vps4A-EQ-expressing cells. Scale bars represent 10 μm. (E) Quantitation of microtubule binding by each population of HSV particles in PNS of cells expressing Vps4A (black bars) or Vps4A-EQ (gray bars). Data were obtained by counting microscopic fields similar to those presented in panels A and C. Particle populations are indicated below the bars as follows: R, HSV labeled only with mRFP1; RB, HSV particles exhibiting mRFP1 and anti-gD fluorescence; RBG, HSV particles exhibiting mRFP1, anti-gD, and GFP fluorescence; RG, HSV particles exhibiting mRFP1 and GFP fluorescence. Plotted values represent means and standard deviations. The total numbers of particles examined were 1,546 (from Vps4A cells) and 1,276 (from Vps4A-EQ cells).
