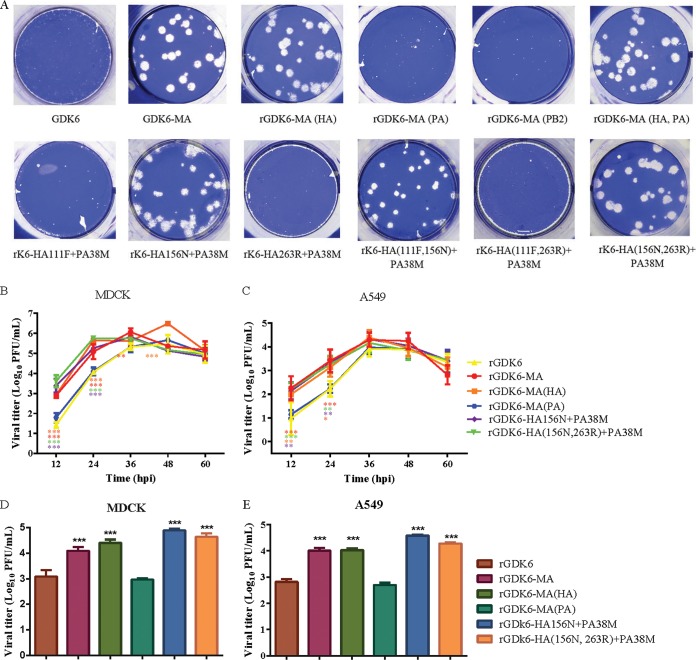
FIG 5.
Growth properties of the parental and mutated viruses. (A) Plaques formed by the indicated viruses in MDCK cells 48 h after inoculation. (B and C) Growth curves after inoculation of each virus at MOIs of 0.01 and 0.1 into MDCK and A549 cells, respectively. Each point on the curve is the mean ± standard deviation from four independent experiments. Titers of viruses that are significantly different from those of rGDK6 are marked as follows: *, P < 0.01; **, P < 0.001; ***, P < 0.0001. Statistical analysis was performed by two-way ANOVA. (D and E) Single-replication-cycle experiments after inoculation of each virus at MOIs of 5 and 10 into MDCK and A549 cells, respectively. Each column indicates the mean ± standard deviation from three independent experiments at 6 hpi. Titers of viruses that are significantly different from those of rGDK6 are marked as described for panels B and C. Statistical analysis was performed by one-way ANOVA.

