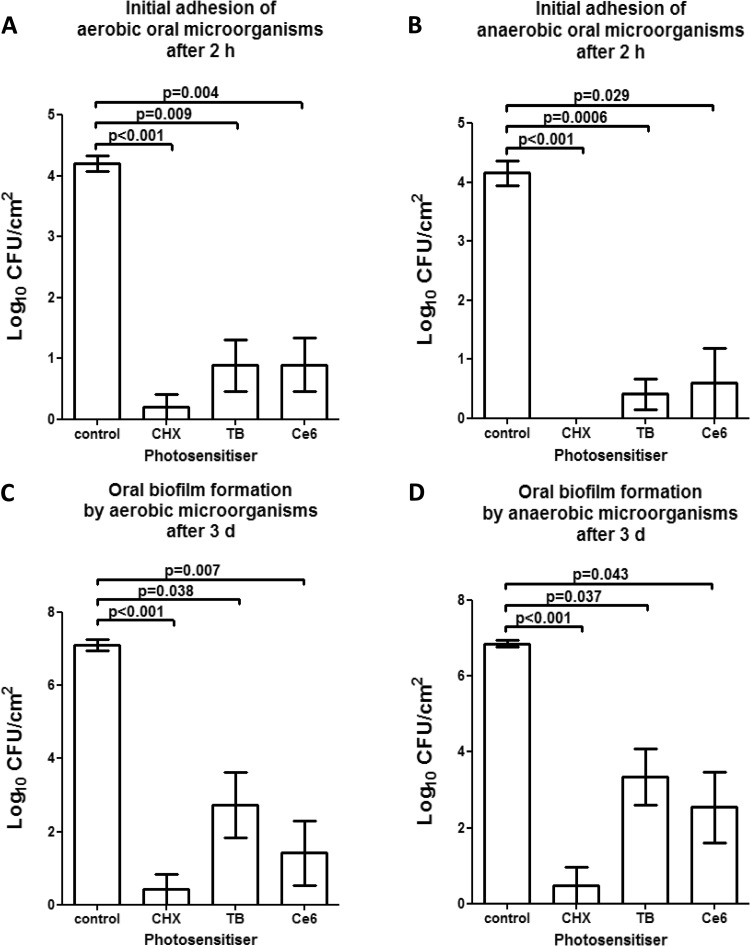
FIG 3.
Graphs of the numbers of CFU, demonstrating the photodynamic efficiency against aerobic and anaerobic oral microorganisms during initial adhesion (A and B) and biofilm formation (C and D), respectively. Toluidine blue (TB) and chlorin e6 (Ce6) served as photosensitizers. An untreated negative control and a chlorhexidine-treated (CHX) positive control were also tested after 2 h or 3 days, respectively. The CFU are presented on a log10 scale per square centimeter (log10/cm2). The P values (t test) of the significantly different data are marked on the graphs.

