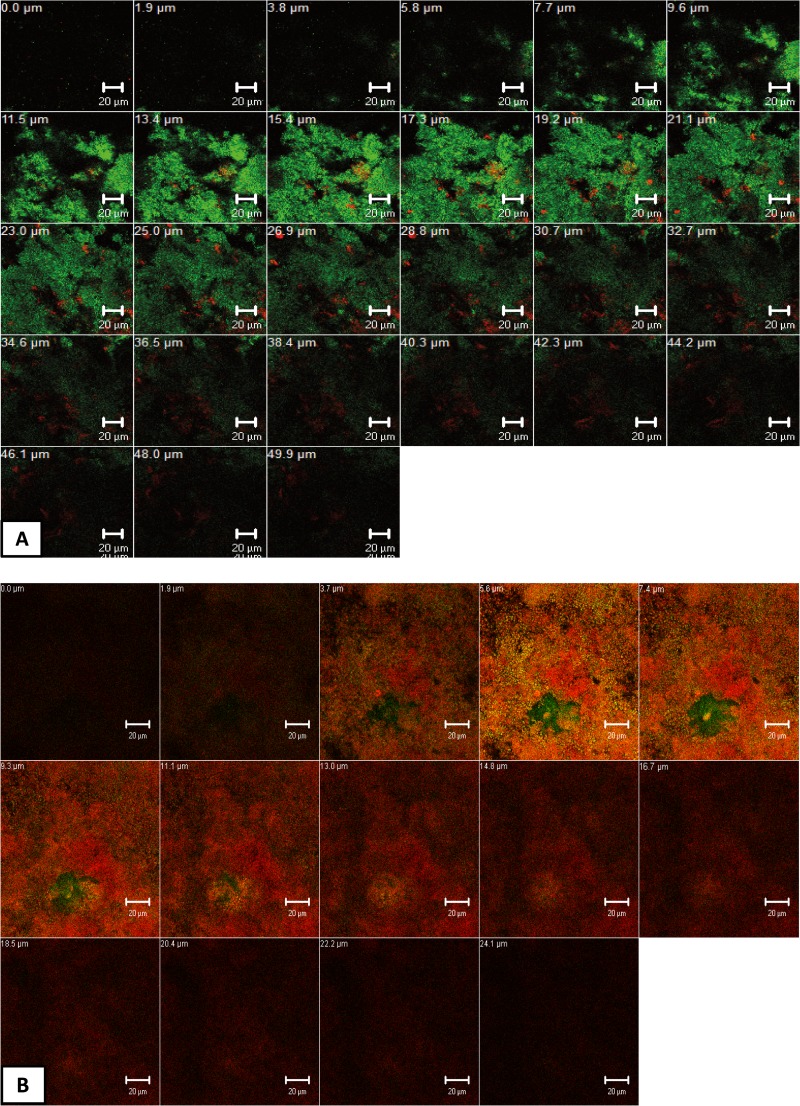
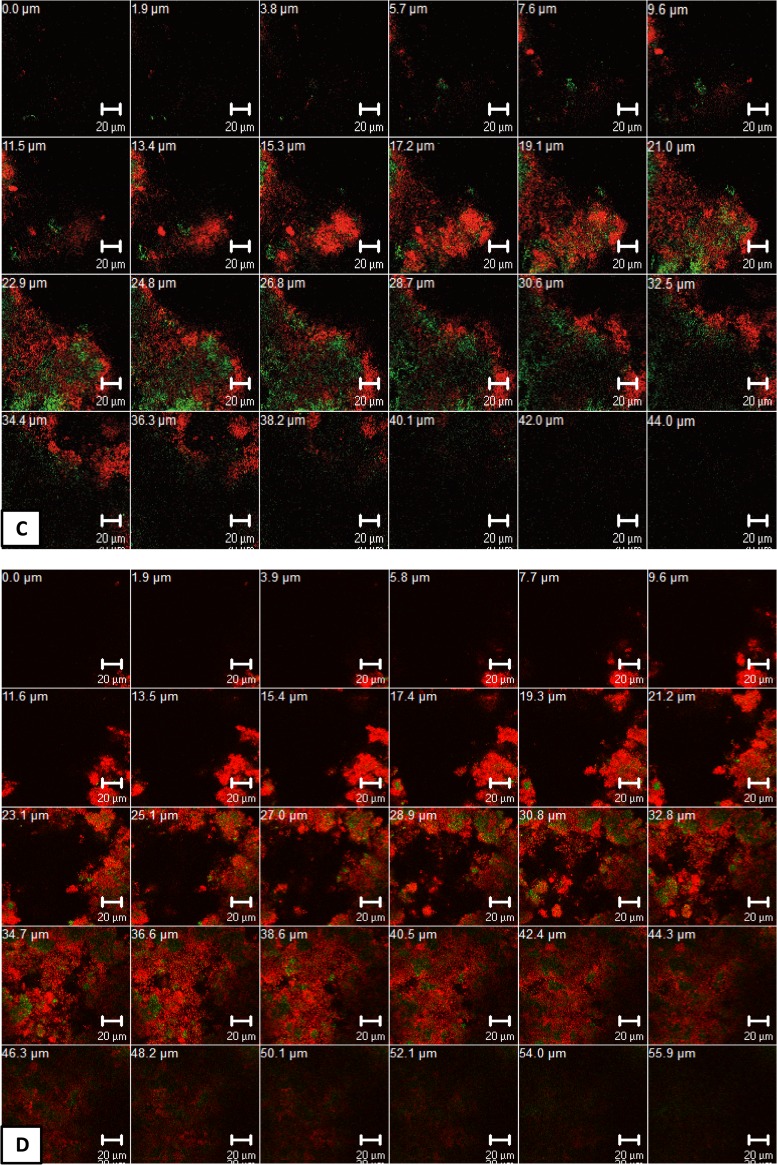
FIG 6.
Z-section galleries of representative confocal laser scanning microscopic (CLSM) images depicting the photodynamic effect on oral biofilm formation (3 days) after live/dead staining. The panels illustrate the live (green) and dead (red) microbial populations of the untreated negative control (A), the chlorhexidine-treated (CHX) positive control (B), and APDT-treated groups in the presence of either toluidine blue (TB) (C) or chlorin e6 (Ce6) (D). The multiple Z sections in panels A to D were generated by vertical sectioning in 0.5-μm (A) or 2.0-μm (B to D) intervals through the sample above the bovine enamel surface, respectively. Bars, 20 μm.


