
FIG 7.
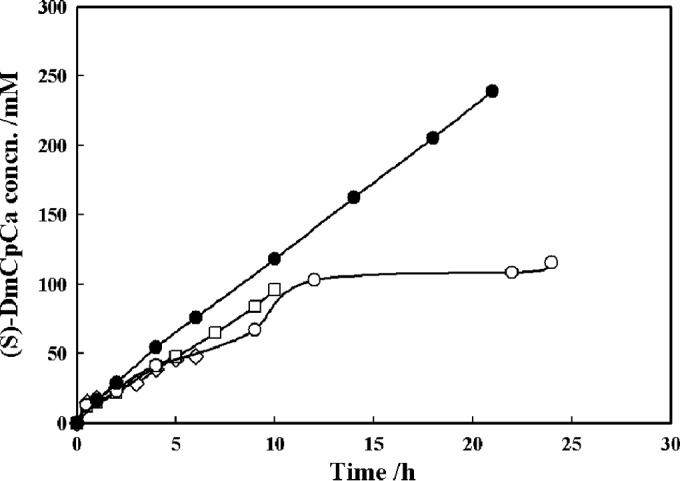
Progress curves of the RhEst1-catalyzed kinetic resolution of rac-DmCpCe with different substrate loads. ◇, 100 mM; □, 200 mM; ○, 500 mM with 10 g/liter RhEst1 and with pH control; ● 500 mM with 25 g/liter RhEst1 and with pH control.
Official websites use .gov
A
.gov website belongs to an official
government organization in the United States.
Secure .gov websites use HTTPS
A lock (
) or https:// means you've safely
connected to the .gov website. Share sensitive
information only on official, secure websites.
Progress curves of the RhEst1-catalyzed kinetic resolution of rac-DmCpCe with different substrate loads. ◇, 100 mM; □, 200 mM; ○, 500 mM with 10 g/liter RhEst1 and with pH control; ● 500 mM with 25 g/liter RhEst1 and with pH control.