
FIG 5.
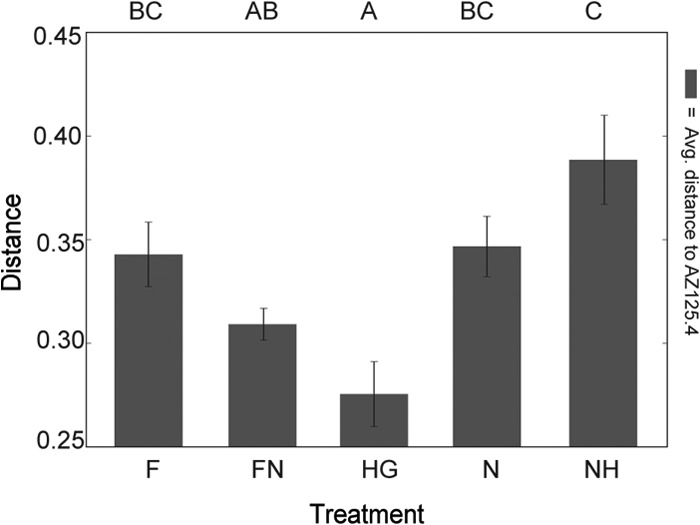
Average weighted UniFrac distances between representative control sample (AZ125.4) and transmission route treatment groups. Letters above the chart demonstrate shared significance groups at P < 0.05 evaluated with a 2-sided nonparametric t test with 1,000 Monte Carlo iterations, Bonferroni corrected.