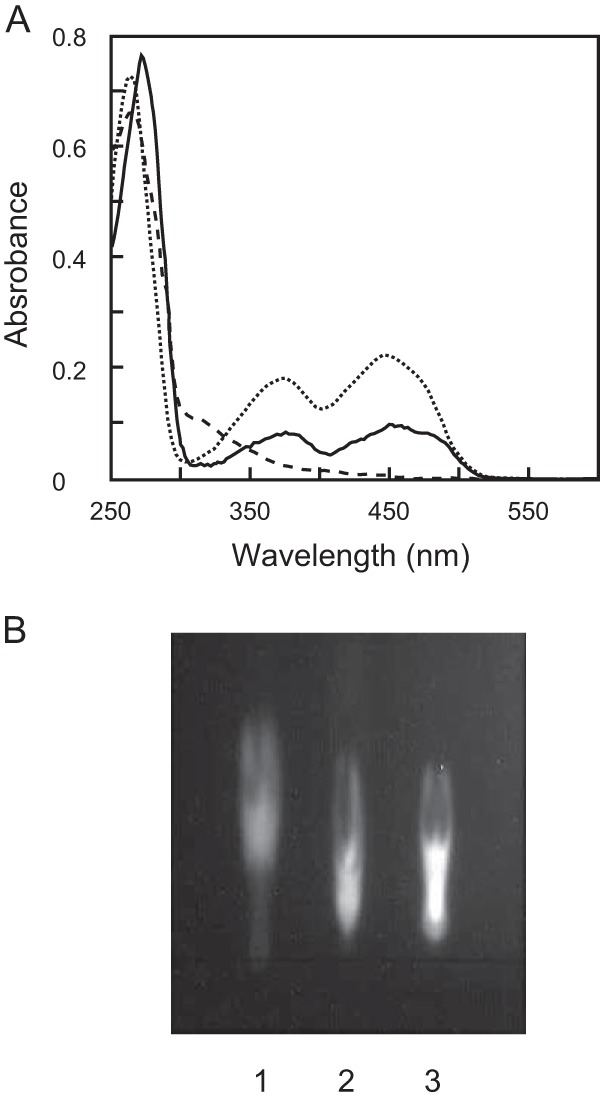
FIG 3.

Absorption spectra of RxDAO and TLC analysis of its cofactor. (A) RxDAO (20 μM) in 50 mM potassium phosphate buffer (pH 8.0) was analyzed before (solid line) and after (dashed line) incubation with 50 mM d-valine for 10 min at 40°C. The dotted line indicates FAD (20 μM) in the same buffer. (B) TLC analysis of RxDAO flavin. Lanes: 1. FMN; 2, FAD; 3, flavin from RxDAO.
