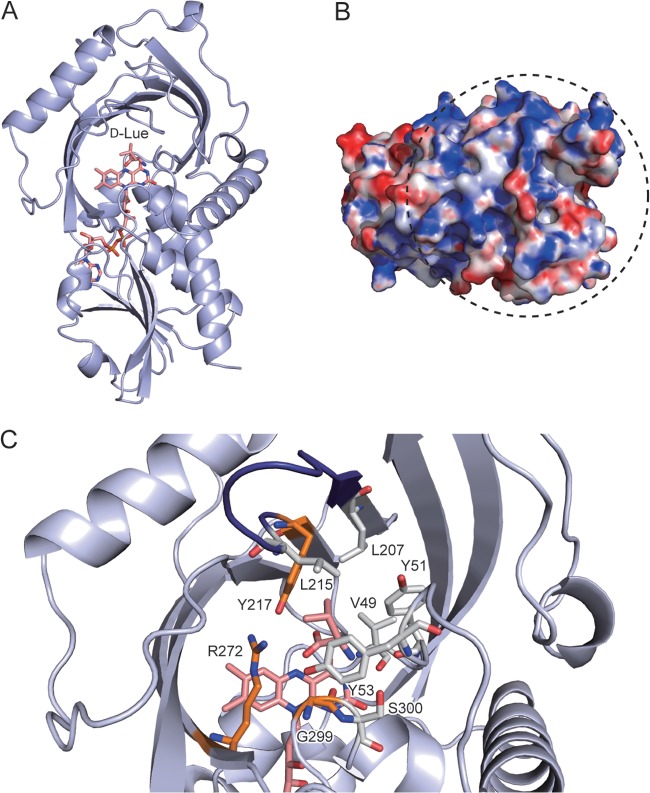
FIG 6.
Three-dimensional model of RxDAO. (A) Overall structure model in complex with d-leucine. The carbon, oxygen, and nitrogen atoms in FAD and d-leucine are shown in pink, red, and blue, respectively. (B) Electrostatic surface potential of RxDAO. The surface is colored from blue (positive) to red (negative). The surface region shown within a dashed circle corresponds to the dimer interface of hDAO and pkDAO. The electrostatic surface potential was calculated by Adaptive Poisson-Boltzman Solver (APBS; http://www.poissonboltzmann.org/) and scaled to a range between −10 kTe−1 and 10 kTe−1. (C) Active-site model in complex with d-leucine. Amino acid residues that possibly interact with the α-amino and carboxy groups of d-leucine are shown in orange. Amino acid residues that cover the side chain of d-leucine and a serine residue (S300) possibly involved in the inactivation by PMSF are shown in gray for carbon atoms. A loop called the active-site lid is shown in deep blue. These images were prepared by using PyMOL 1.6.x.

