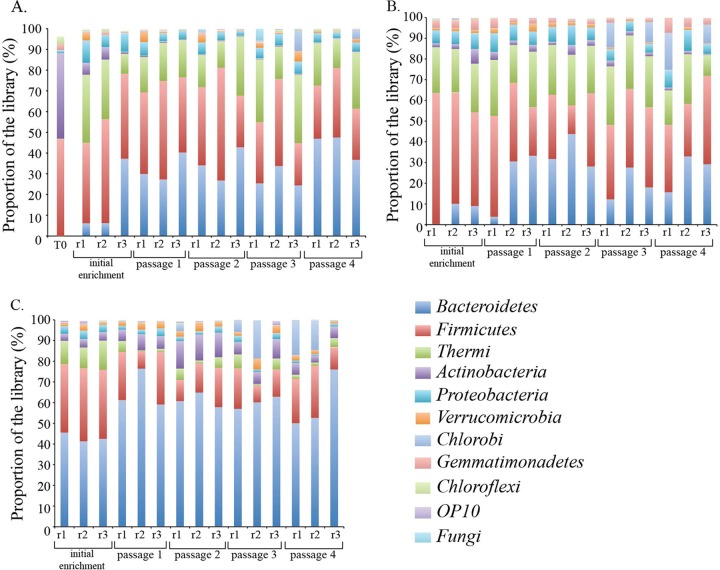
FIG 1.
Plot of the relative abundance of dominant phyla (≥3%) based on SSU rRNA amplicon pyrosequencing for the untreated (A)-, AFEX-pretreated (B)-, and IL-pretreated (C)-switchgrass-adapted consortia for the initial enrichment and passages 1 through 4. Biological replicates are depicted for each passage. Newby Island compost time zero (T0) is also depicted. A cutoff of 3% or more abundance was chosen to highlight the most abundant organisms present in the community.

