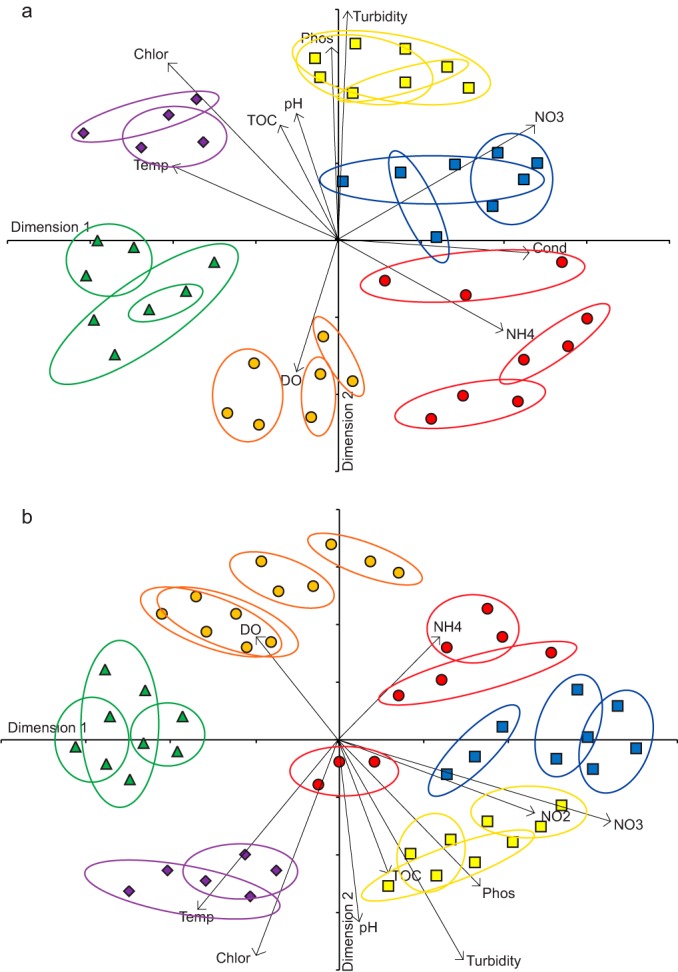
FIG 5.

NMDS ordinations of bacterioplankton communities sampled from the Arkansas (green triangles), Illinois (purple diamonds), Missouri (yellow squares), Ohio (red circles), Tennessee (orange circles), and Upper Mississippi (blue squares) rivers and the underlying physicochemical factors driving community differences. Plots represent free-living (a) (stress = 0.27) and particle-associated (b) (stress = 0.26) communities analyzed using Jaccard similarity scores excluding rare taxa accounting for <0.001% of the data set. Arrows indicate environmental factors that were significantly (P < 0.01) correlated with scores on at least one NMDS axis for each plot and the direction and extent of influence, with arrow length reflecting the strength of the relationship. Colored rings group samples taken from the same site on a particular river.
