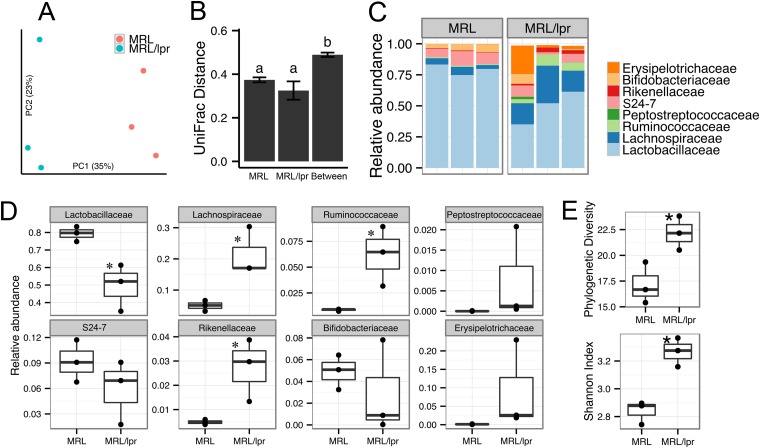
FIG 1.
Differences in gut microbiota between healthy and lupus-prone mice. (A) Microbiota separation on the first two principal coordinates calculated from unweighted UniFrac distances. MRL, healthy control mice; MRL/lpr, lupus-prone mice. Fecal samples from 5-week-old female mice were used. The number of sequences in each of the six samples was 7,800. (B) UniFrac distances within and between mouse strains. Error bars indicate the standard errors of the mean for n = 3 (within MRL), n = 3 (within MRL/lpr), and n = 9 (between the two strains). Statistical significance was determined by one-way ANOVA, followed by pairwise t test with TukeyHSD-adjusted P values. (C) Taxonomy breakdown at the family level for abundant (>0.1%) bacterial OTU. (D) Bacterial abundance comparison between MRL and MRL/lpr microbiota. (E) Diversity indices. Statistical comparison was based on an unpaired Student t test (n = 3 in each group; *, P < 0.05; **, P < 0.01).

