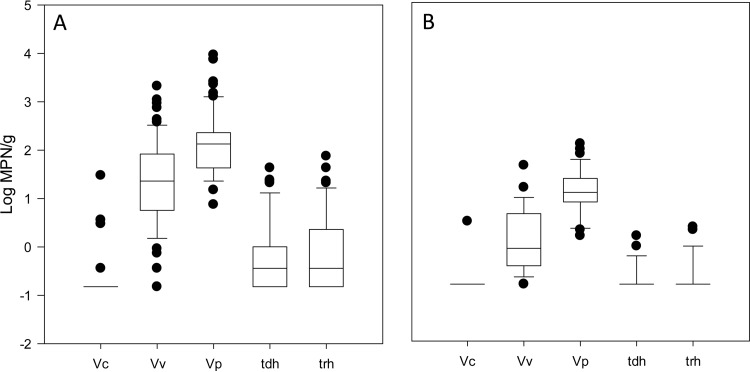
FIG 2.
Vibrio species levels in shellfish harvested from Long Island Sound. Shown are box plots of V. cholerae (Vc), V. vulnificus (Vv), total V. parahaemolyticus (Vp), and potentially pathogenic (tdh+ and trh+) V. parahaemolyticus in oysters (A) and clams (B). For observations below the LOD (−0.52 log MPN/g), the value of 1/2 the LOD was substituted. The band inside each box indicates the median value. Lower and upper lines of the box represent the 25th and 75th percentiles, respectively. Lower and upper limits of the whiskers represent the 10th and 90th percentiles, respectively.

