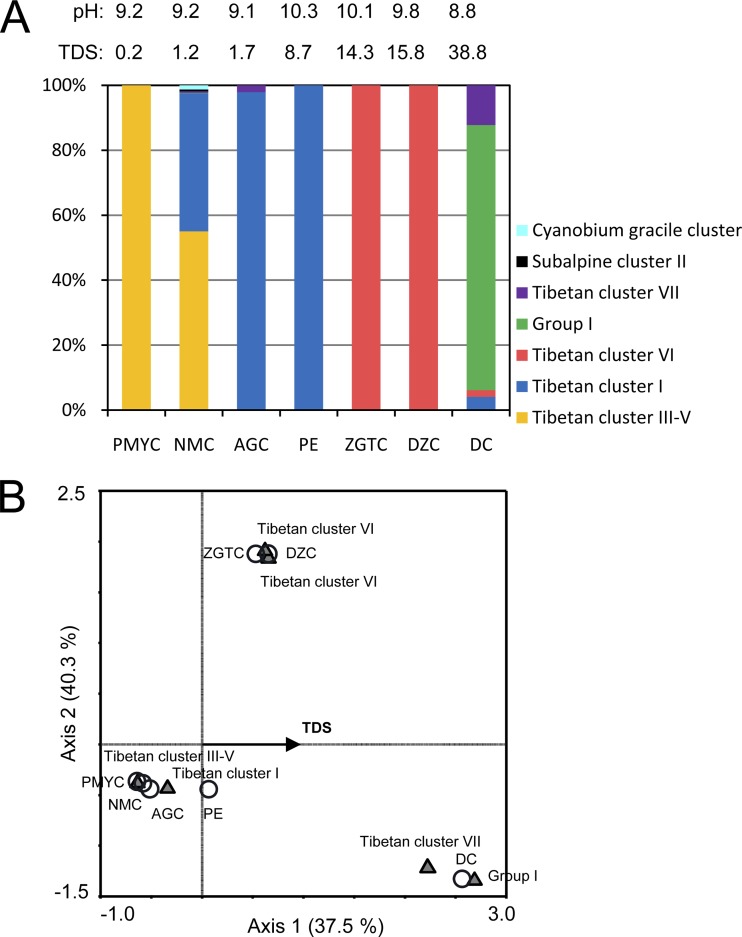
FIG 3.
(A) Picocyanobacterial population composition in the Tibetan lakes. The TDS density and pH are shown for the surface water of each lake. (B) CCA diagram showing the correlation between picocyanobacterial community compositions and environmental factors. In order to avoid possible bias, for Lake NMC and Lake ZGTC, only surface water samples that were collected in non-ice seasons were included in this analysis. Therefore, OTUs of two picocyanobacterial lineages, the C. gracile cluster and subalpine cluster II, are not shown. Also, note that Tibetan cluster VI contained two OTUs. Among the environmental factors tested, only TDS significantly explained the species-environment correlation (P < 0.05). Axes 1 and 2 explained 37.5% and 40.3% of the variations in diversity, respectively. On the diagram, lakes are indicated by circles and OTUs are indicated by triangles, and the affiliation of each OTU is shown.

