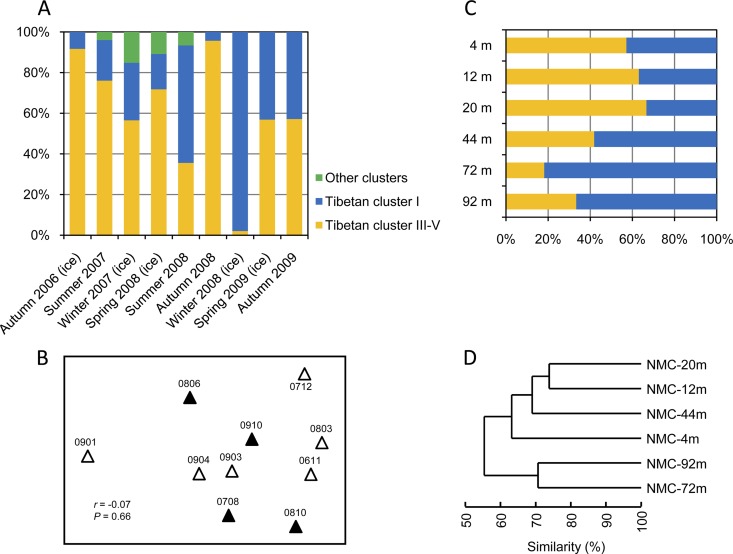
FIG 5.
(A) Seasonal variation of picocyanobacterial community compositions in Lake NMC across 3 years. (B) NMDS showing the similarities among seasonal picocyanobacterial communities of Lake NMC. Late autumn, winter, and spring samples (ice seasons) are indicated by open triangles and summer and early autumn samples (non-ice seasons) by filled triangles. The numbers accompanying the triangles indicate the sampling years and months, for example, 0806 represents June 2008. The results of the ANOSIM test (r = −0.07; P = 0.66) are shown. (C) Vertical variation of picocyanobacterial community compositions in Lake NMC along a depth profile of six layers. (D) Clustering of the picocyanobacterial communities along a vertical profile of Lake NMC.

