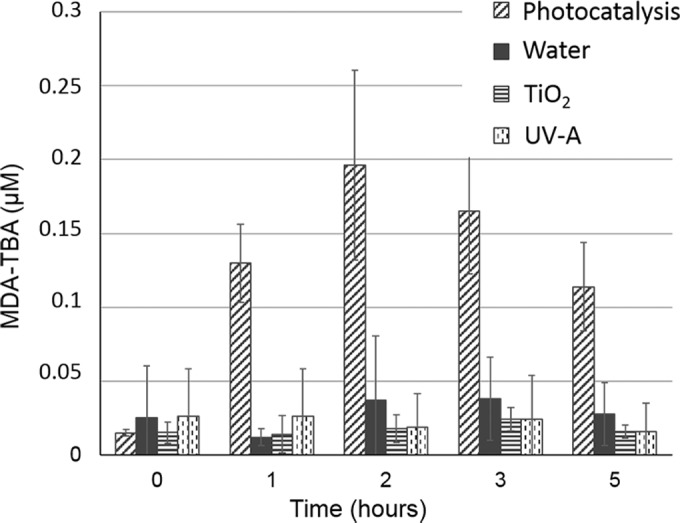
FIG 3.

Lipid oxidation analysis during photocatalytic treatment. S. cerevisiae cells were treated with photoactivated TiO2 for 5 h, and the MDA-TBA concentration was monitored as described in Materials and Methods. The MDA-TBA level was monitored in control conditions (water, UV-A, or TiO2).
