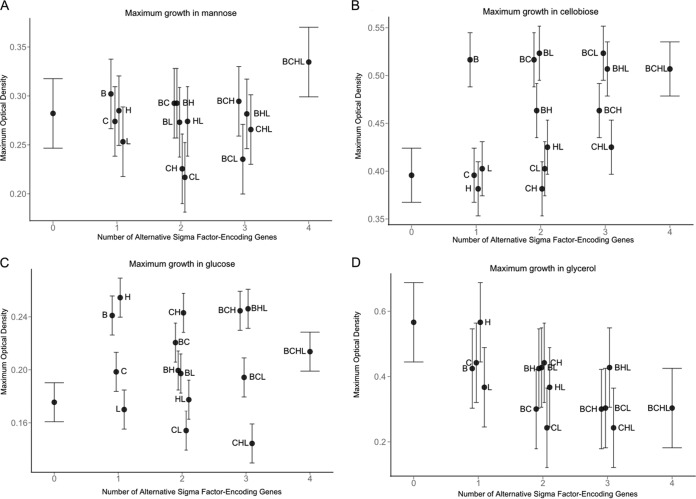
FIG 3.
Estimates for maximum OD (ODmax) in DM with mannose (A), cellobiose (B), glucose (C), or glycerol (D) for 10403S and 15 isogenic mutants at 37°C. Error bars indicate 95% confidence intervals. The ODmax value is shown along the y axis. The number of alternative σ factor-encoding genes present, ranging from zero (ΔsigB ΔsigC ΔsigH ΔsigL quadruple mutant) to 4 (parent strain 10403S), is shown along the x axis.

