
FIG 4.
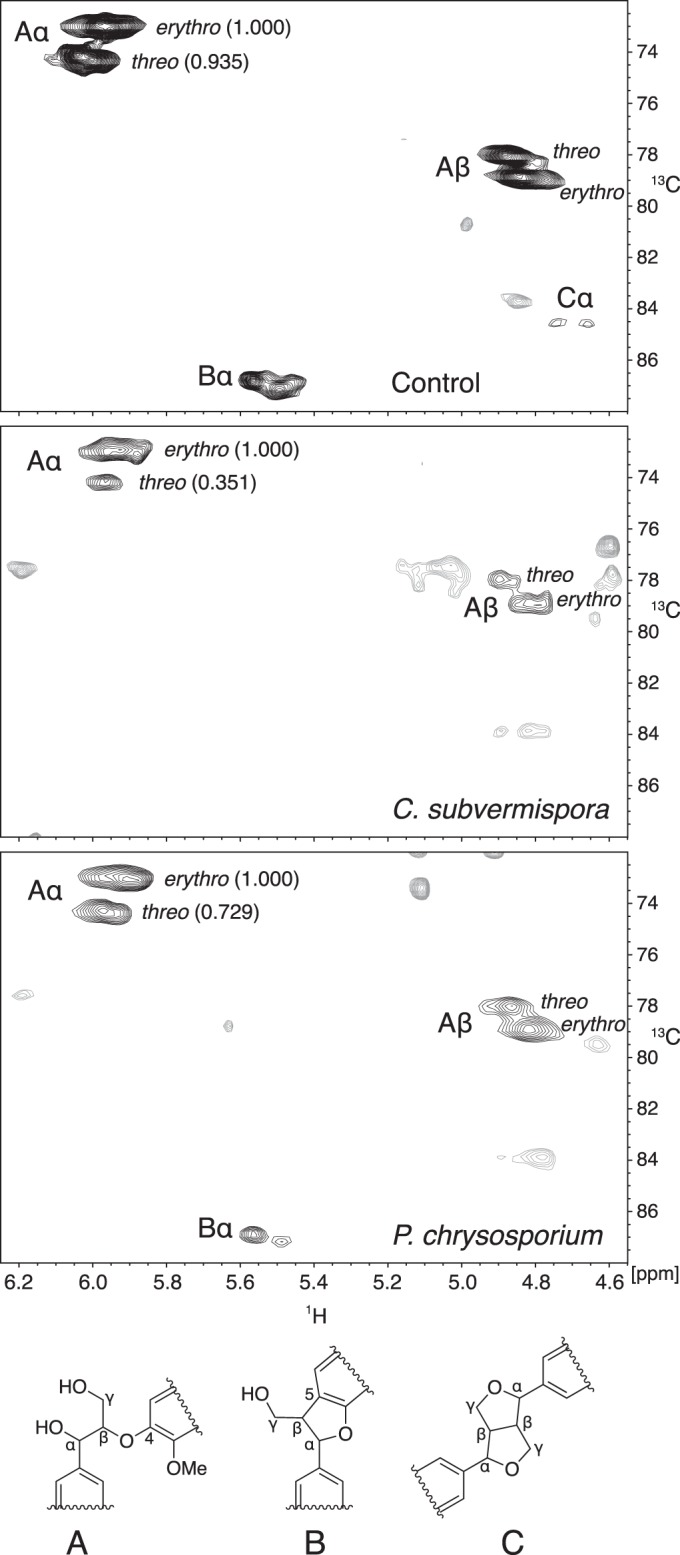
1H-13C HSQC NMR spectra obtained on acetylated lignins from control and degraded spruce wood. Labels next to the black contours associate them with particular carbons in the three lignin structures shown. Numbers in parentheses next to the Aα contours are relative integrals of the contour volumes. Unassigned contours are shown in gray.