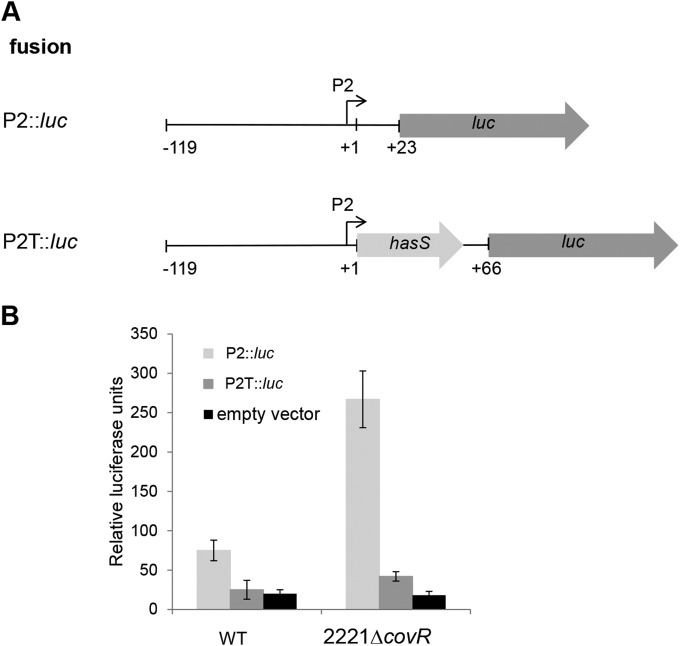
FIG 4.
Transcriptional analysis of the P2 promoter. (A) The schematic representations of the transcriptional fusions to the luc reporter. The fusion names, the fragment from the hasA upstream sequence that is carried by each plasmid (thin line), the promoters (bent arrows), hasS (light-gray arrow), and the luc gene (dark-gray arrow) are shown. Numbers indicate nucleotide positions relative to the HasS transcriptional start (+1). (B) Relative promoter activity determined by luciferase assay at mid-exponential growth phase for P2::luc and P2T::luc reporter plasmids in the WT and 2221ΔcovR strains. Luciferase activity expressed by each strain was determined as described in Materials and Methods. Each data point represents the average, and the error bars denote the standard deviations derived from at least 3 experiments from independent clones done in triplicate.

