FIG 1.
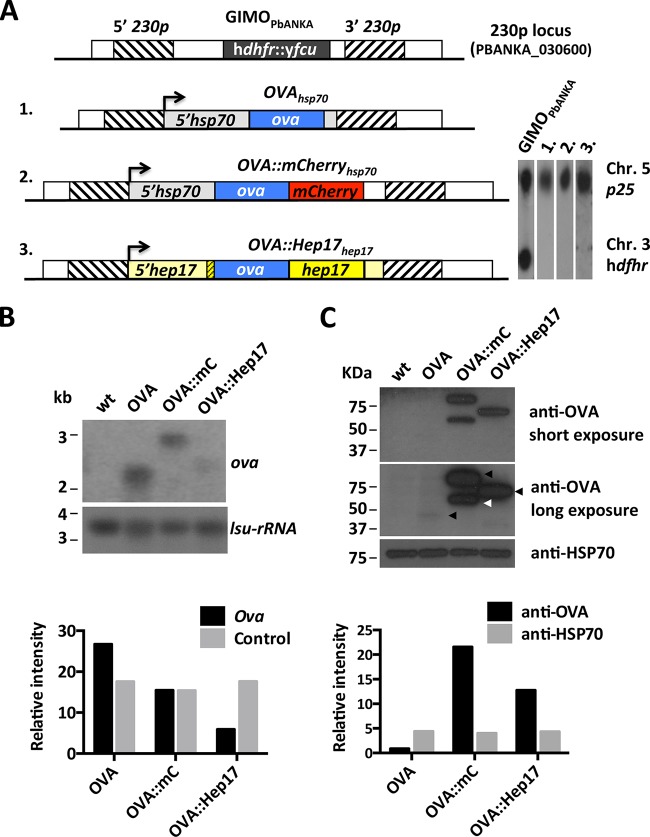
Different transgenic P. berghei ANKA lines expressing OVA. (A) (Left) Schematic representation of the 230p locus in the reference GIMOPbANKA mother line and in 3 OVA-expressing transgenic lines. GIMOPbANKA has the positive and negative selectable marker cassette (hdhfr::yfcu; black box) inserted into 230p. The OVA expression cassettes were introduced into 230p by double-crossover homologous recombination at the target regions (hatched boxes), using the method of GIMO transfection. Line 1 (1988cl1; OVAhsp70) encodes full-length ovalbumin (ova; blue box) under the control of the 5′ (promoter)- and 3′ (terminator)-UTRs of the hsp70 gene (gray boxes). Line 2 (2027cl1; OVA::mCherryhsp70) encodes OVA which is C-terminally fused to mCherry (red box) under the control of the 5′-UTR of hsp70 and the 3′-UTR of dhfr/ts (white box). Line 3 (2030cl1; OVA::Hep17hep17) encodes OVA flanked by the N-terminal signal peptide of hep17 (bp 1 to 81; yellow hatched box) and the remainder of the hep17 open reading frame (bp 82 to 726; yellow box), under the control of the 5′- and 3′-UTRs of the hep17 gene (light yellow boxes). The direction of transcription is indicated by the arrows. (Right) Southern analyses of PFGE-separated chromosomes confirmed the integration of the constructs into the 230p locus on chromosome 3 (Chr), resulting in the removal of the hdhfr::yfcu selection cassette. Hybridization was performed with a mixture of two probes: a control probe recognizing p25 on chromosome 5 and an hdhfr probe recognizing hdhfr::yfcu. (B) Northern blot analysis of OVA-transgene transcription in purified schizonts of the 3 transgenic lines. Blots were hybridized using a PCR probe recognizing ova (primers 6466 and 6467). As a loading control, the oligonucleotide probe L644R, which recognizes the large-subunit (lsu) rRNA gene, was used. Quantification of the hybridization signals showed that OVAhsp70 (OVA) and OVA::mCherryhsp70 (OVA::mC) parasites had comparable levels of ova transcripts, while in OVA::Hep17hep17 (OVA::Hep17) parasites the transcript levels were lower. The relative intensities of the hybridization signals were quantified using ImageJ. wt, wild-type P. berghei ANKA parasites. (C) Western analysis of OVA-transgene expression levels in purified schizonts of the 3 transgenic lines (arrowheads on the long-exposure image indicate the OVA products of expected sizes). Blots were stained with anti-OVA antibodies. Anti-HSP70 antibody staining was used as a loading control. Quantification of the staining signals showed hardly detectable OVA expression in OVAhsp70 parasites. In OVA::mCherryhsp70 parasites, an OVA product of the expected size (2nd black arrow) was detected, in addition to a smaller (truncated) product (white arrow). The relative intensities of OVA signals (long exposure) were quantified using ImageJ.

