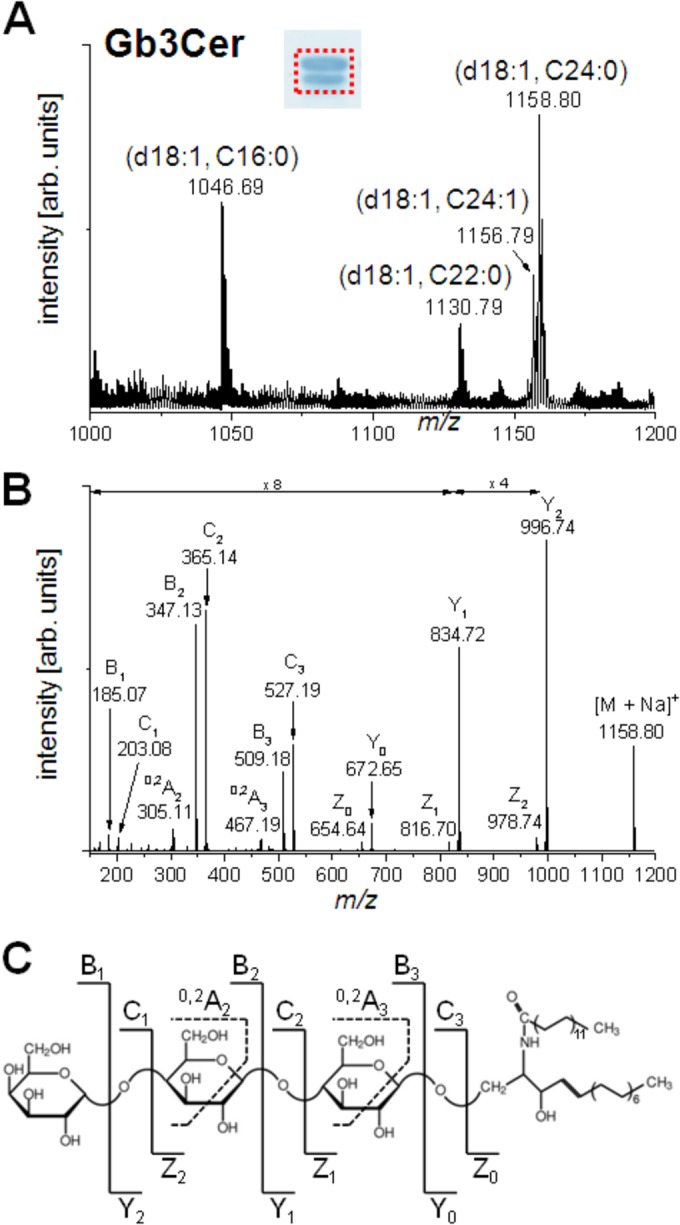
FIG 3.

Positive-ion-mode ESI–Q-TOF mass spectra of antibody-detected Gb3Cer species from T24 cells. (A) Overview of the MS1 spectrum obtained from the silica gel extract of the TLC overlay assay (shown in the inset) performed with an aliquot of GSL at an amount corresponding to the amount from 1 × 10⁶ cells. The area comprising the immunostained double band, from which the silica gel was scraped off, is indicated by a dotted rectangle. (B) Low-energy CID MS2 spectrum of monosodiated Gb3Cer (d18:1, C24:0) with m/z 1,158.80. (C) Molecular structure and explanatory fragmentation scheme of Gb3Cer (d18:1, C24:0). arb., arbitrary.
