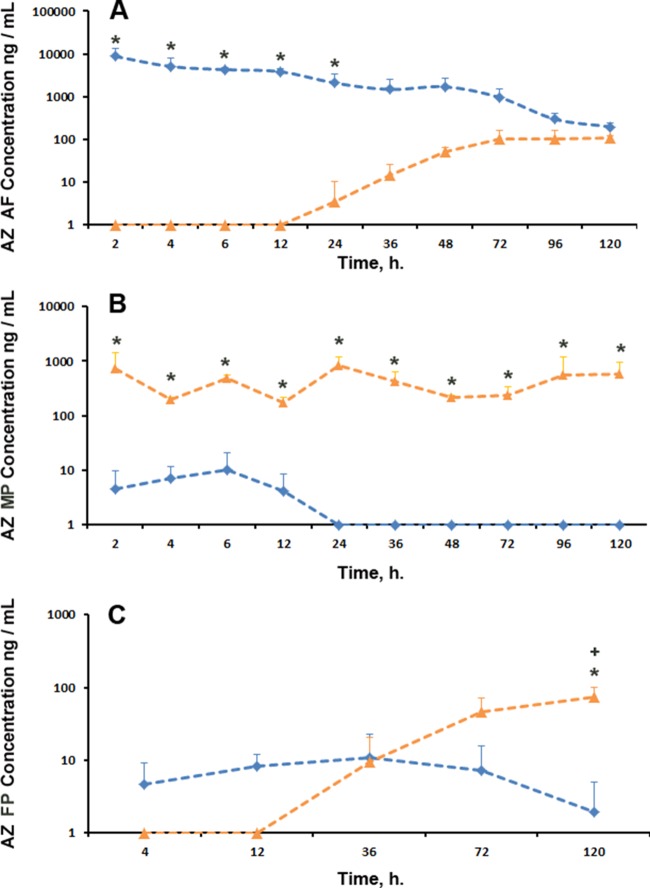
FIG 3.
Concentrations of AZ in AF (A), MP (B), and FP (C) following single IA AZ (blue) and repeated maternal i.v. AZ (orange) administrations. *, significant differences (P < 0.05) in AZ concentrations between single IA AZ and repeated maternal i.v. AZ groups; +, significant differences (P < 0.05) between FP AZ concentrations in the repeated maternal i.v. AZ group at 120 h and the repeated maternal i.v. AZ group at 4 to 72 h. The error bars indicate SD.

