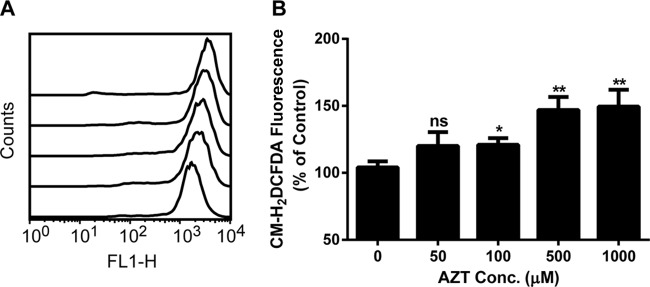
FIG 2.

AZT promotion of ROS production in U2OS cells after 3 days of exposure. Cells were prepared as described in Materials and Methods. (A) Representative flow cytometric offset histogram of the fluorescence of oxidized products of CM-H2DCFDA in U2OS cells exposed to various concentrations of AZT (from bottom to top, the curves depict treatment with 0, 50, 100, 500, and 1000 μM AZT). (B) Relative intracellular ROS levels in cells treated with AZT. The results are expressed as the average percentage ± standard error of the mean (SEM) of the control value (n = 3). *, P < 0.05, compared with the control; **, P < 0.01, compared with the control; ns, not significant. FL1-H represents the green fluorescence intensity resulting from CM-H2DCFDA oxidation.
