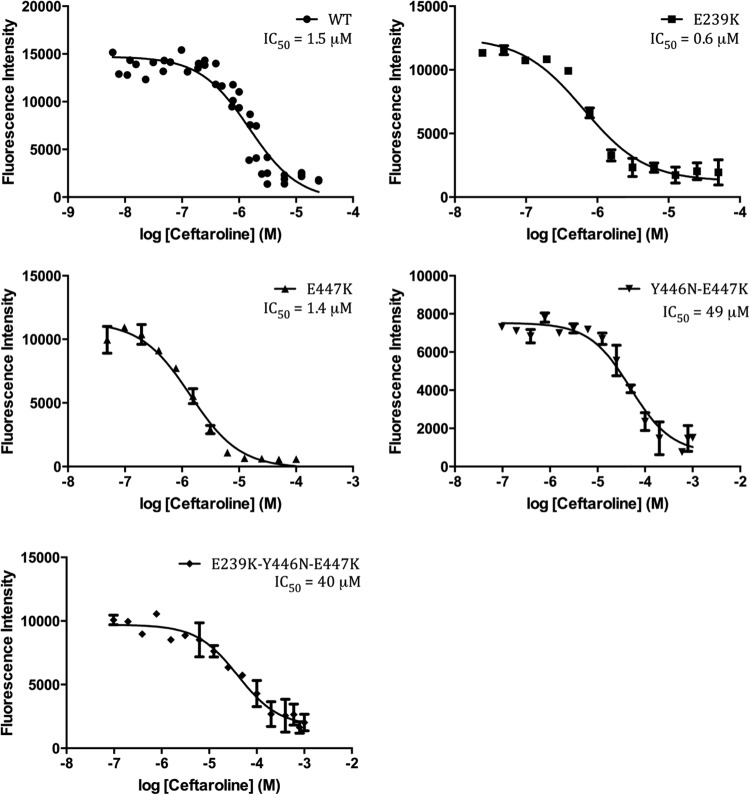
FIG 3.
Bocillin competition assay to determine the IC50 of ceftaroline for the PBP2a wild type and mutants. The y axis represents the residual fluorescence intensity of Bocillin, while the x axis represents the logarithmic ceftaroline concentration (in molar). The Y446N mutant did not show any decrease in fluorescence intensity even with the highest concentration of inhibitor tested, and thus, the results for that mutant are not represented here.

