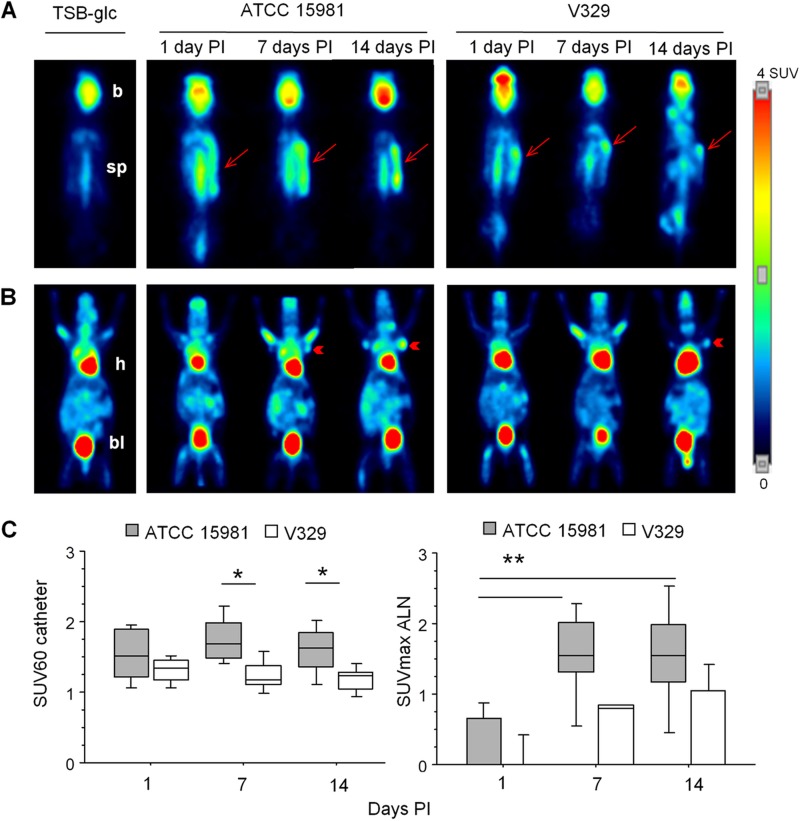
FIG 4.
Representative [18F]FDG-MicroPET images in mice carrying catheters infected with S. aureus strains ATCC 15981 or V329. Slices at dorsal (A) and ventral (B) positions show [18F]-FGD uptake in catheter (arrows) or axillary lymph node (ALN; arrowheads) areas, respectively. Brain (b), heart (h), bladder (bl), and spinal cord (sp) show physiological uptake of [18F]-FGD. In panels A and B, each image corresponds to a representative animal analyzed at days 1, 7, and 14 PI. Images of uninfected controls (receiving only TSB-glc) are included on the left. (C) Box plots illustrating the evolution of the SUV60 index in S. aureus ATCC 15981 or V329 infections in the catheter area (left panel) and SUVmax in ALN (right panel). Statistical comparisons by Fisher's PLSD test: *, P < 0.05; **, P < 0.005.

