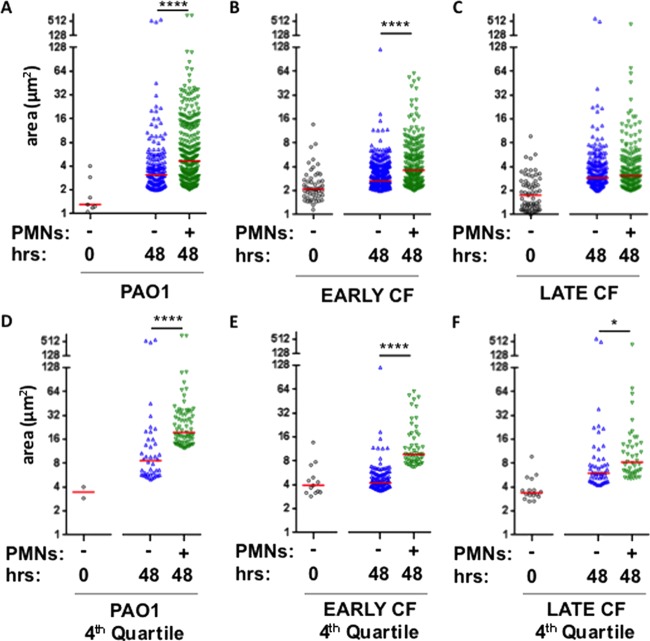
FIG 3.
Distribution of aggregate size in the presence and absence of neutrophil lysates. Size of aggregates (μm2) plotted on a log2 scale formed within the initial inoculum (○) and aggregates formed after 48 h in the absence (△) or presence (▽) of neutrophil products. (A and D) Strain PAO1; (B and E) early CF strain; (C and F) isogenic late CF strain; (D to F) larger aggregates were measured in the top quartile of aggregate size. Red bars represent the median for each condition. Analysis of variance performed for each strain. ****, P < 00001; *, P < 0.05, by Kruskal-Wallis test.

