
FIG 5.
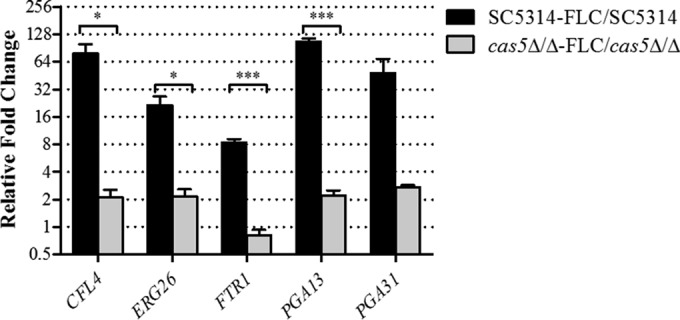
Validation of fluconazole-inducible and Cas5-dependent gene expression. Expression levels of CFL4, ERG26, FTR1, PGA13, and PGA31 were measured in triplicate by qRT-PCR and compared to the expression levels in SC5314. Shown are the relative n-fold changes in gene expression in SC5314 and cas5Δ/Δ mutants treated with fluconazole (FLC). Error bars represent the standard errors of the means. Asterisks represent significance levels (*, P < 0.05; ***, P < 0.001).