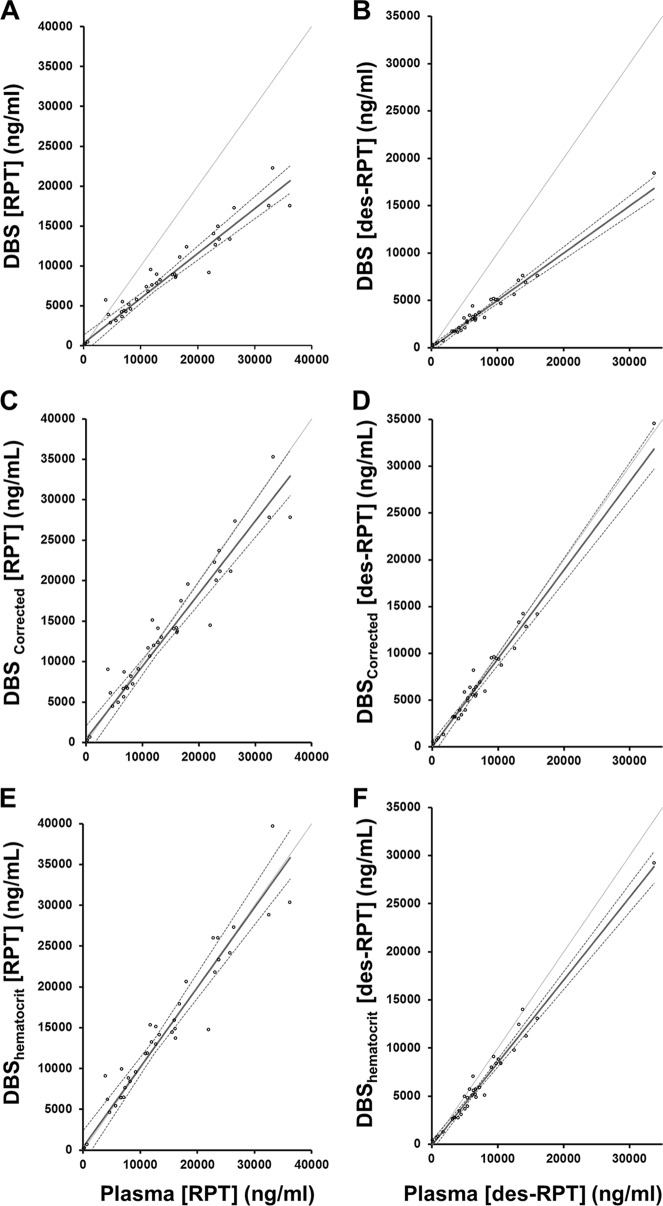
FIG 5.
Passing-Bablok regression between concentrations in whole-blood DBS and plasma are displayed. The dark solid line is the Passing-Bablok fit, and the dashed lines are the 95% CI bands. The scatter plots illustrate uncorrected whole-blood rifapentine (A) and desacetyl-rifapentine (B) versus plasma drug concentrations, with regression line slopes and intercepts of 0.56 (95% CI, 0.50 to 0.64) and 303 (95% CI, −188 to 1,142), and 0.50 (95% CI, 0.47 to 0.55) and −8.84 (95% CI, −239 to 133), respectively. (C and D) Bland-Altman-corrected whole-blood rifapentine (C) and desacetyl-rifapentine (D) drug concentrations compared to those in plasma, with regression line slopes and intercepts of 0.90 (95% CI, 0.80 to 1.01) and 443 (95% CI, −273 to 1,652), and 0.95 (95% CI, 0.89 to 1.03) and −31.7 (95% CI, −489 to 185), respectively. (E and F) Participant-specific hematocrit-corrected whole-blood rifapentine (E) and desacetyl-rifapentine (F) concentrations compared to those in plasma, with regression line slopes and intercepts of 0.98 (95% CI, 0.87 to 1.10) and 356 (95% CI, −452 to 1,827), and 0.86 (95% CI, 0.81 to 0.93) and −144 (95% CI, −500 to 73.1), respectively.

