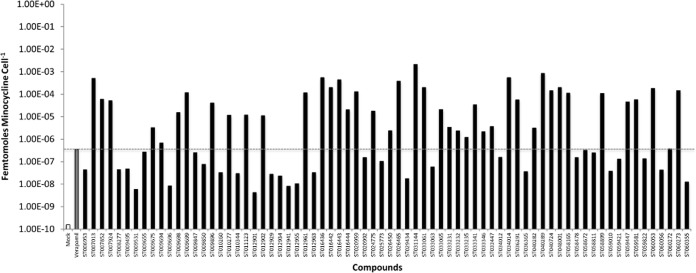
FIG 2.
A. baumannii intracellular minocycline concentration measures. Shown are the fmol of minocycline per cell following the growth of strain 98-37-09 in serum supplemented with 0.5 μg ml−1 minocycline (y axis) in the absence (white bar) or presence (gray bar) of the efflux pump inhibitor verapamil, or the presence of 0.5× the minimum effective concentration of the indicated putative efflux pump inhibitor (x axis). The dashed gray line represents the concentration of minocycline per cell grown in human serum supplemented with minocycline and verapamil for comparison.

