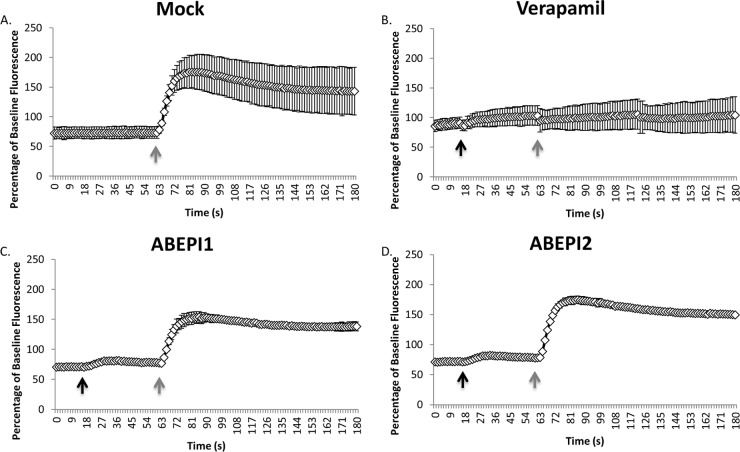
FIG 5.
Mammalian calcium channel inhibition assays. (A) Cytoplasmic Ca2+ measures of mock-treated cells pre- and posttreatment with carbachol (60 s) (gray arrow). (B to D) Same as panel A except that cells were treated with verapamil (50 μg ml−1) (B) or 1× the MEC of ABEPI1 (ST009675; 2 μg ml−1) (C) or ABEPI2 (ST060273; 32 μg ml−1) (D) at 45 s (black arrow) pre-carbachol treatment.

