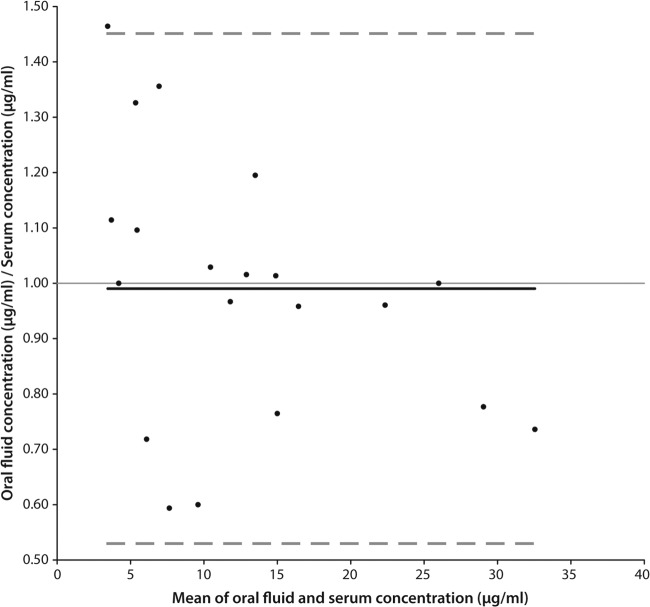
FIG 2.
Bland-Altman plot of the oral fluid-to-serum drug concentration ratio versus the mean concentration in oral fluid and serum. The bias is presented as a solid line, and the 95% limits of agreement are presented as dashed lines. The mean bias is 0.99 (95% CI, 0.88 to 1.10), and the lower and upper 95% limits of agreement are 0.53 (95% CI, 0.34 to 0.72) and 1.45 (95% CI, 1.27 to 1.64), respectively.

