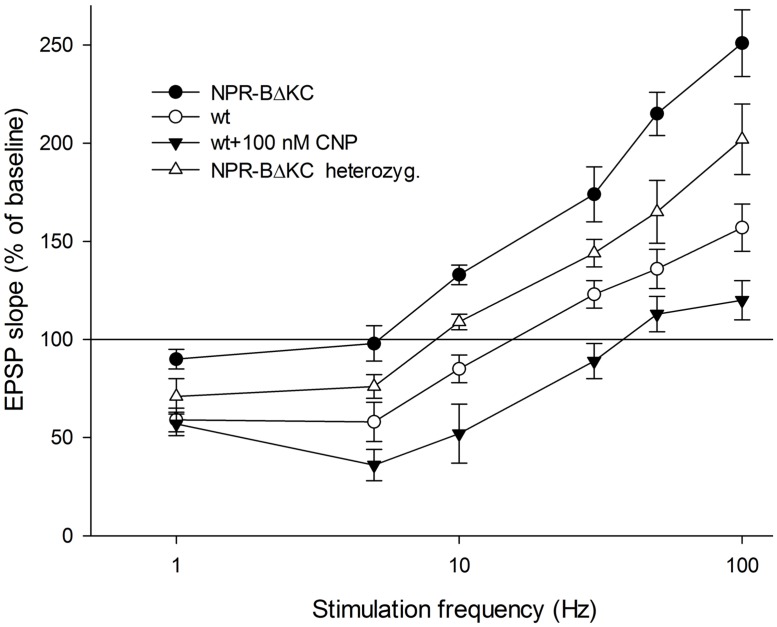
FIGURE 3.
Relative changes in the EPSP slope expressed in % of baseline stimulation after HF stimulation at 100 Hz for 1 s as recorded 50–60 min after stimulation in hippocampal slices from homozygous NPR-BΔKC rats, heterozygous NPR-BΔKC rats, slices from wild type rats (wt) and slices from wild type rats incubated with the NPR-B agonist CNP (100 nM). Stimulation frequencies used were 1, 5, 10, 30, 50, and 100 Hz.

