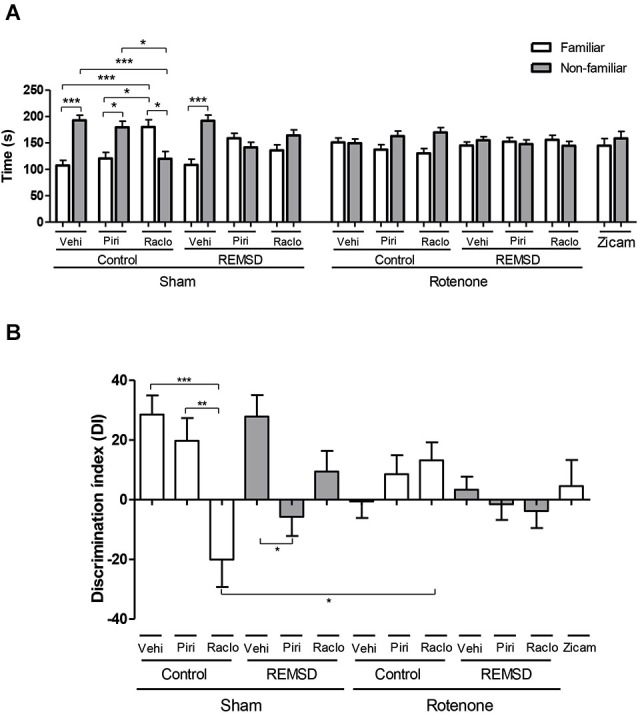
Figure 1.

(A) Time (s) spent in familiar and non-familiar compartments in the olfactory discrimination task (ODT) 7 days after surgery. The bars represent the mean ± standard error of the mean. n = 15 per group, *P ≤ 0.05, ***P ≤ 0.001 comparing the time mean spent in familiar and non-familiar compartments. Two-way ANOVA followed by the Bonferroni test. (B) Olfactory discrimination index (DI) calculated by (NF-F/NF+F)*100, NF is the time spent in the compartment with non-familiar odor and F is the time spent in the compartment with familiar odor. The bars represent the mean ± standard error of the mean, n = 15 per group, *P ≤ 0.05, **P ≤ 0.01, ***P ≤ 0.001. One-way ANOVA followed by the Newman-Keuls test.
