
Figure 5.
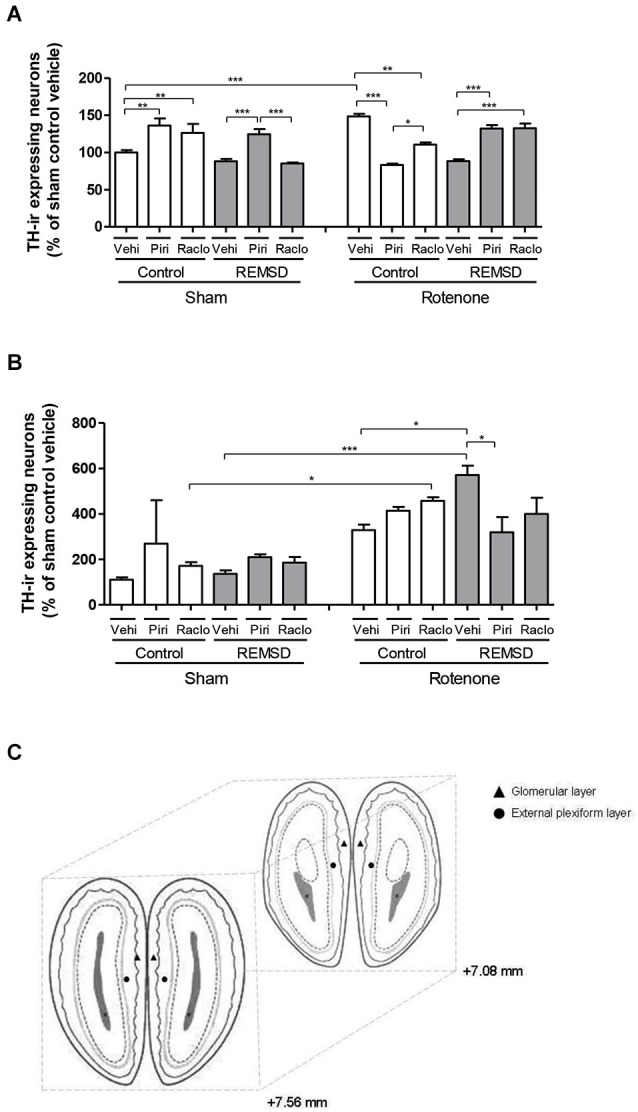
(A) Percentage of TH-ir expressing neurons in the glomerular layer of the olfactory bulb in relation to sham control vehicle group. The bars represent the mean ± standard error of the mean, n = 5 per group, *P ≤ 0.05, **P ≤ 0.01, ***P ≤ 0.001. One-way ANOVA followed by the Newman-Keuls test. (B) Percentage of TH-ir expressing neurons in the external plexiform layer of the olfactory bulb in relation to sham control vehicle group. The bars represent the mean ± standard error of the mean, n = 5 per group, *P ≤ 0.05, ***P ≤ 0.001. One-way ANOVA followed by the Newman-Keuls test. (C) Schematic diagram representing the coordinates (mm) and sections used in immunohistochemistry for TH in the glomerular layer (triangle) and external plexiform layer (circle) of the olfactory bulb (adapted from Paxinos and Watson, 2005).