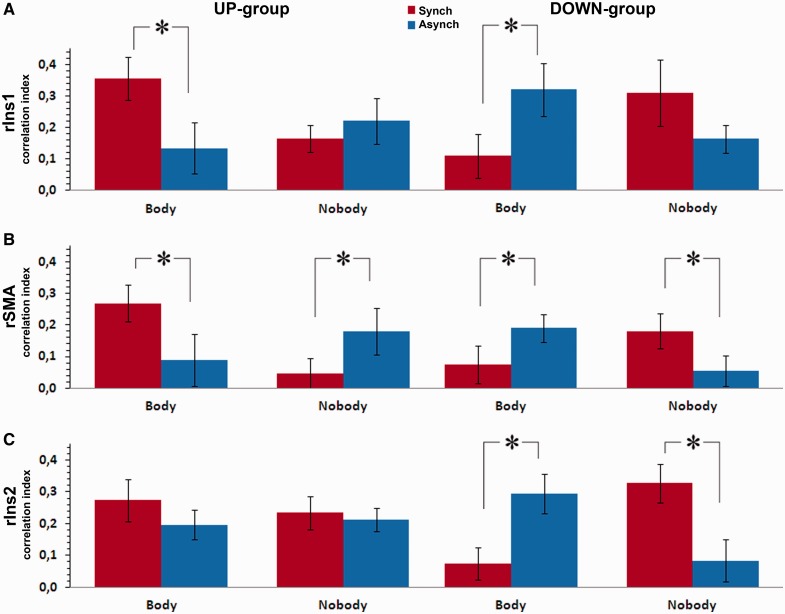
Fig. 4.
Connectivity patterns. Correlation index between right TPJ and right Insula (A), right TPJ and right SMA (B), left TPJ and right Insula (C). Synchronous (red) and asynchronous stroking (blue) are represented for each condition. Asterisks and error bars represent significant differences and standard errors, respectively.

