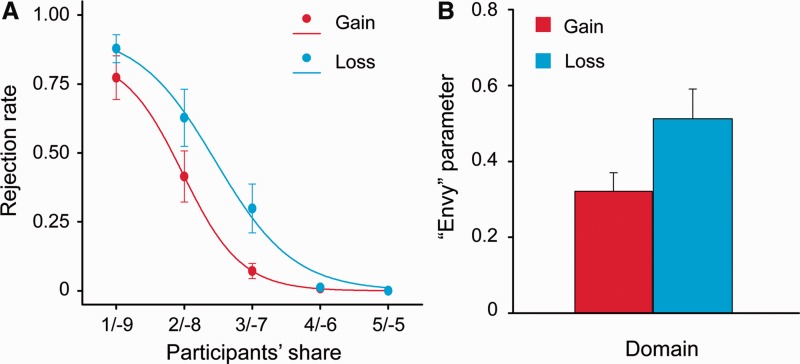
Fig. 2.
Behavioral and modeling results from the UG. (A) Points indicate rejection rates in gain (red) and loss domains (blue), respectively. Lines are rejection rates as a logistic function fitted to those points. (B) The ‘envy’ parameter (α) derived from the computational model (Wright et al., 2011) in gain and loss domains. Error bars represent s.e.m.

