Fig. 4.

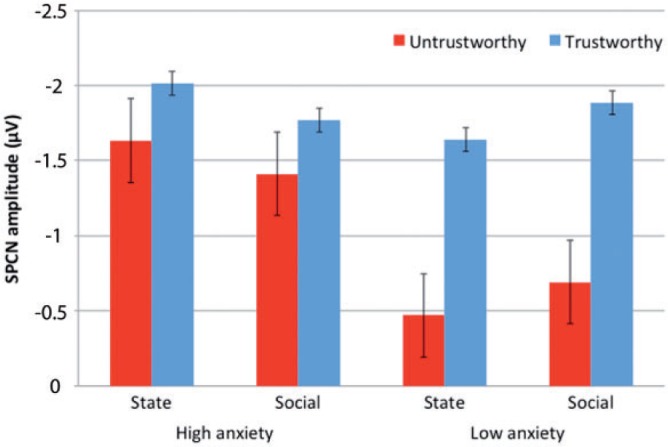
Bar graph of mean SPCN amplitudes, with standard error bars, for trustworthy (blue bars) and untrustworthy (red bars) faces for high and low levels of state and social anxiety, separately.

Bar graph of mean SPCN amplitudes, with standard error bars, for trustworthy (blue bars) and untrustworthy (red bars) faces for high and low levels of state and social anxiety, separately.