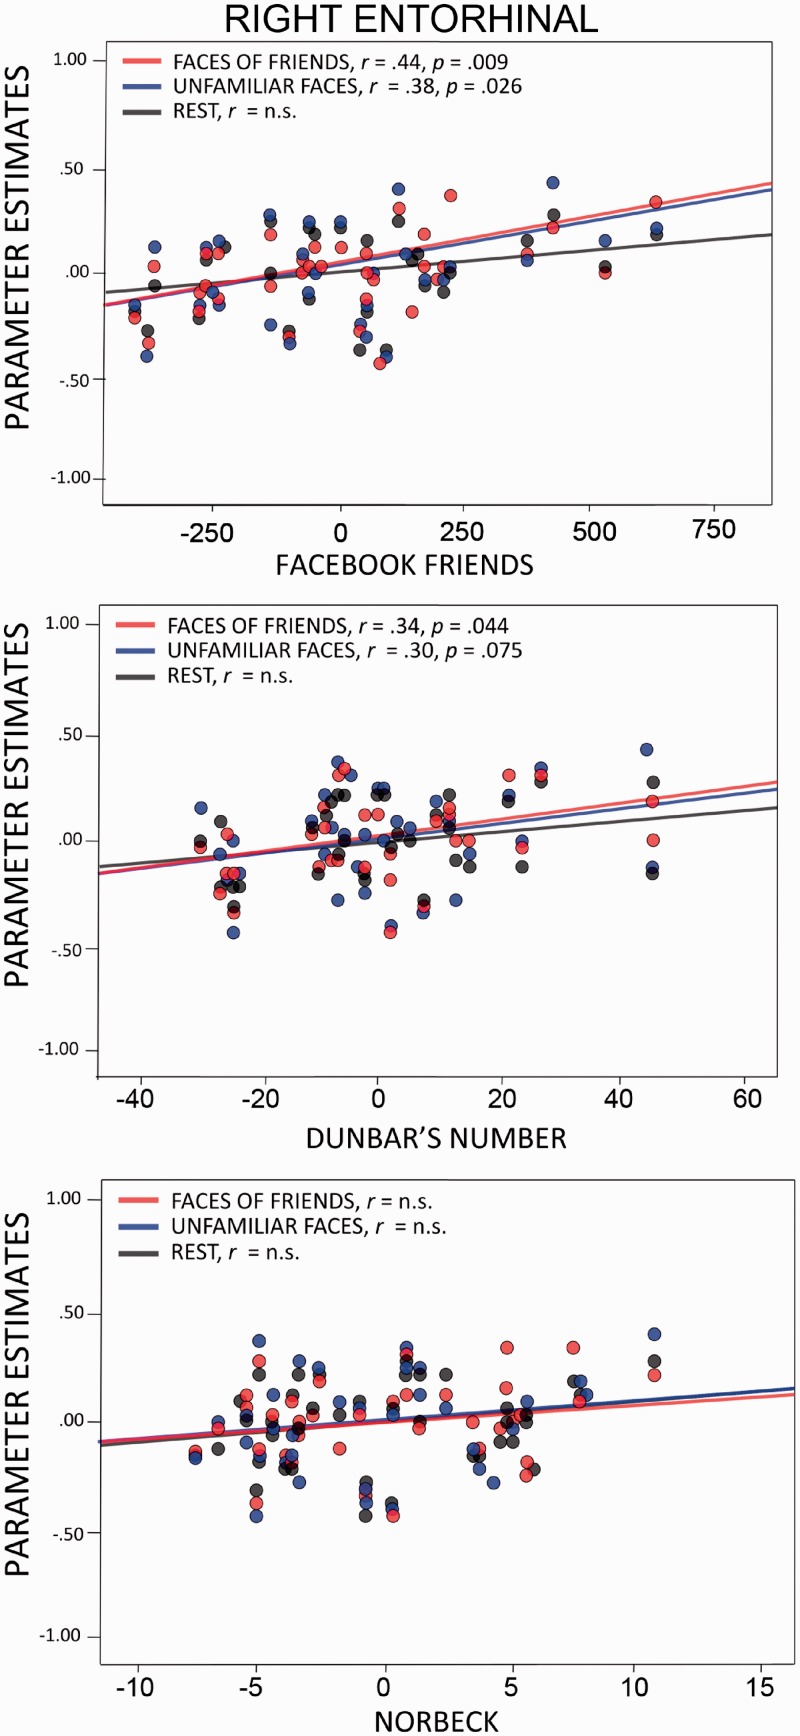
Fig. 5.
Partial correlation scatterplots illustrating the relationship between social network measures and BOLD activity in the right entorhinal cortex controlling for age (n.s. = not significant). The x-axis of each scatterplot represents the standardized residuals of each social network measure, and the y-axis represents the standardized residuals of BOLD activity.

