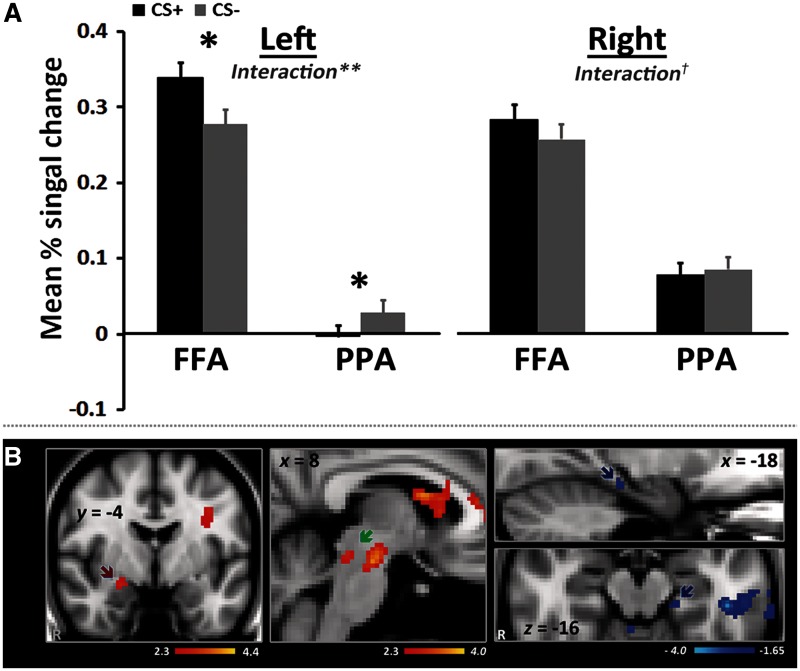
Fig. 3.
(A) ROI results in both FFA as a response area for salient face cues and PPA for non-salient place cues. (B) Functional connectivity results. The amygdala region (red arrow) showed greater positive functional connectivity with FFA during CS+ trials than during CS− trials. The lowered threshold map showed greater positive functional connectivity with FFA during CS+ than CS− trials in brainstem regions including in the region of LC (green arrow) and a greater negative functional connectivity in left PPA region (blue arrows). *P < 0.05, **P < 0.005, †P = 0.087.

