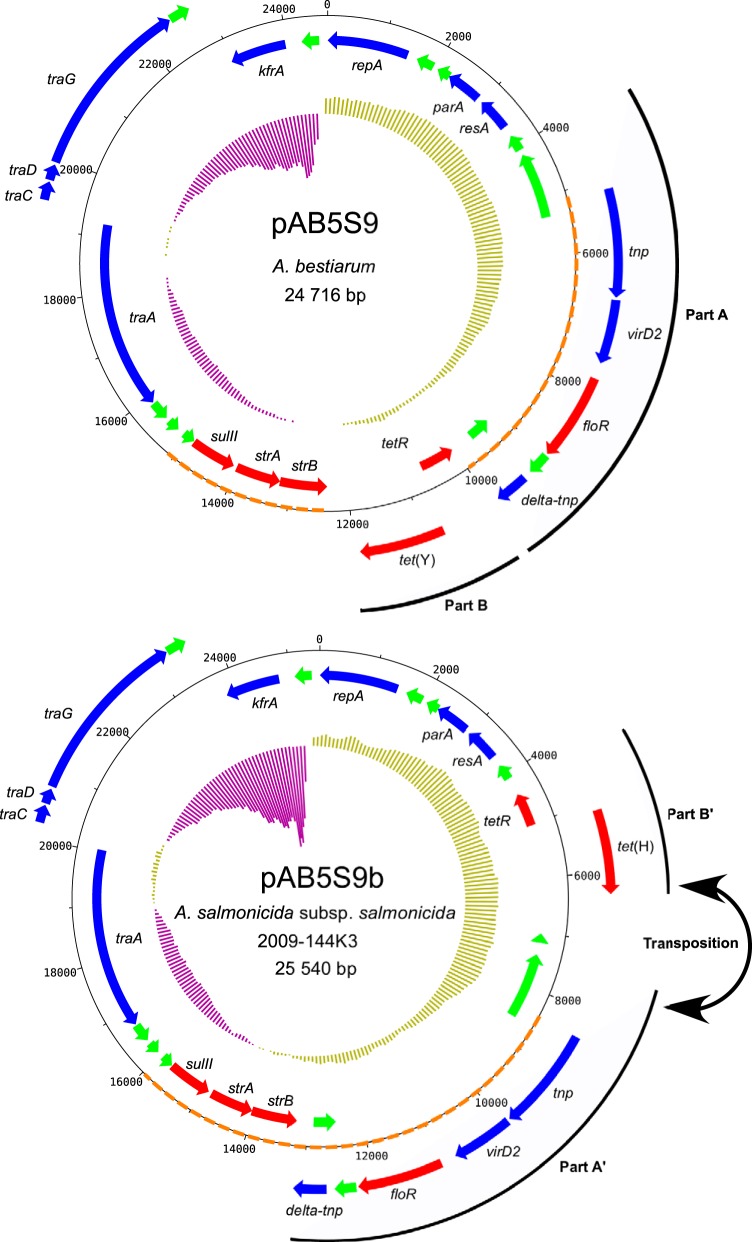
FIG 1.
Maps of pAB5S9 and pAB5S9b. Genes are represented by arrows. Genes on the outside are transcribed clockwise, whereas genes on the inside are transcribed counterclockwise. Red, green, and blue arrows represent genes coding for antibiotic resistance, hypothetical proteins, and other functions, respectively. The inner ring represents the GC skew calculated by DNAPlotter, with a window and step size of 10,000 bp and 100 bp, respectively. Parts A and B in pAB5S9 are transposed in pAB5S9b and are indicated as parts A′ and B′. The orange dotted lines represent the SXT resistance regions in pAB5S9 and pAB5S9b.

