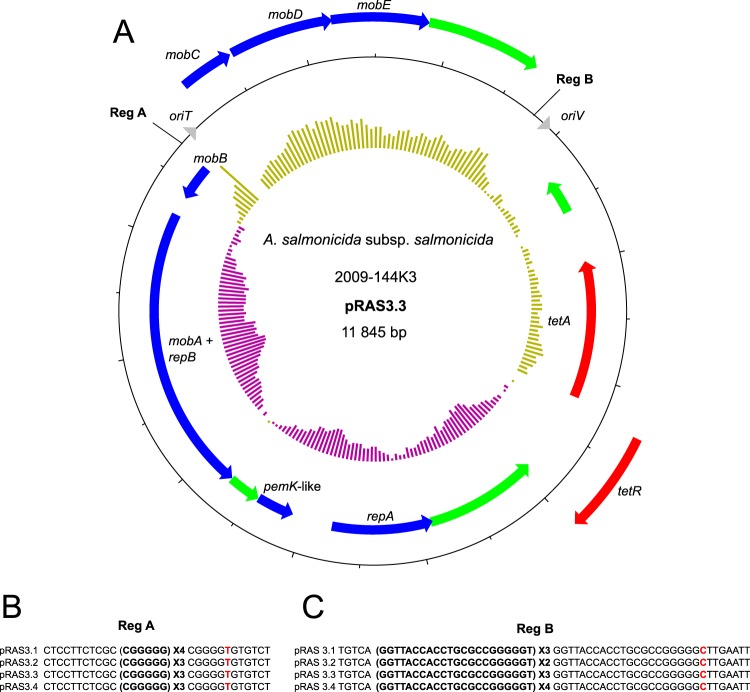
FIG 4.
Map of pRAS3.3 and differences among variants. A. The map of pRAS3.3 in the 2009-144K3 isolate. Genes are represented by arrows. Genes on the outside are transcribed clockwise, whereas genes on the inside are transcribed counterclockwise. Red, green, and blue arrows represent genes coding for antibiotic resistance, hypothetical proteins, and other functions, respectively. The inner ring represents the GC skew calculated by DNAPlotter with a window and step size of 1,000 bp and 50 bp, respectively. Each tick mark represents a 500-bp step. (B and C) Representation of the differences in the number of repeat units between all pRAS3 variants for the region (Reg) A and Reg B spots. The red nucleotides are point mutations in the last repetition unit, either a transversion (B) or a transition (C).

