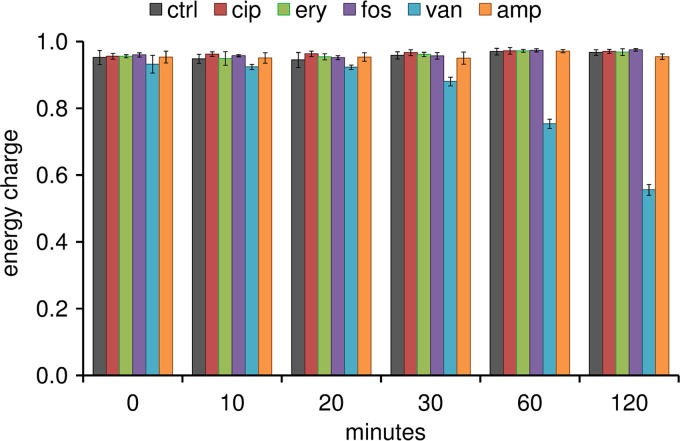
FIG 1.
Adenylate energy charges of untreated cells (black) and cells exposed to ciprofloxacin (cip; red), erythromycin (ery; green), fosfomycin (fos; purple), vancomycin (van; blue), and ampicillin (amp; orange). The AEC was calculated using the intracellular amounts of ATP, ADP, and AMP (nmol/mg cell dry weight). Data are shown as mean values ± standard deviations (SD) for quintuplicate samples.

